Do you want to create your very own Node-RED Dashboard? In this article, we’ll explain how you can easily create a custom Node-RED dashboard. We’ll also show you how to create a Node-RED dashboard that displays camera snapshots, Round-trip Delay (RTD), and SNMP sensor data charts.
In this tutorial, we’ll cover the following topics:
- What is a Node-RED Domotz?
- How to install Node-RED
- Installing the Domotz node
- Creating your first node
- How to create a custom Node-RED dashboard
- Creating an SNMP data chart
- How to create a RTD chart
- Node-RED dashboard example
What is a Node-RED Domotz?
Node-red-domotz is a Node-RED plugin providing easy access to the Domotz Public API. It offers a convenient way to explore the APIs, automate flows, create custom dashboards, and integrate Domotz data with external tools. Getting the most out of Node-red-domotz and our public API, doesn’t require you to have extensive programming skills. This tutorial will help you get started with Node-red-domotz. You’ll learn how to build a custom Node-RED dashboard example for network monitoring and management.
How to install Node-RED
For the Node-RED installation instructions please refer to the official guide.
How to install the Domotz node
To install the Domotz node , search for node-red-contrib-domotz from the “manage palette” menu of Node-RED and install it.
In addition, we recommend installing the node-red-dashboard plugin too, because you’ll need to use it in this tutorial.
How to create your first node
After you complete the installation, the domotz-api node should be available in the palette. You can then drag it into the workspace.

For the node to be functional you need to configure the access info using your API-Key and your endpoint. Bear in mind that we support multiple access keys. Thus, you can manage multiple accounts from the same workspace:

Once you configure the access info, you can select any API method from the dropdown list:

The next step is to retrieve the IDs of all the available agents. For this purpose, select agent.listAgents and click ‘Deploy’. You should see a green marker next to the node if the configuration access is valid:

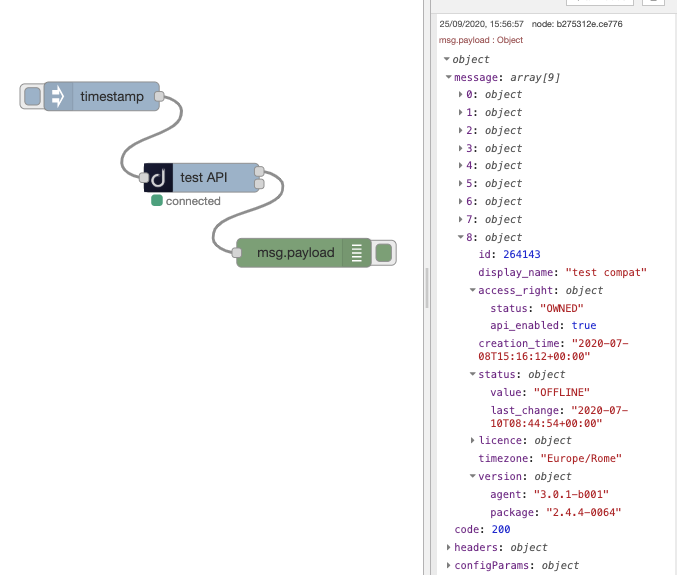
Now create an inject node to trigger the API call and a debug node to display the output.
You can easily configure the inject node to send a periodic trigger, enabling auto-refresh of the data. Again, deploy and click inject.
In the debug space, you will see the API output from which you can extract all the available information about your agents.
How to create a customized Node-RED dashboard
Now that you have deployed a Domotz node, let’s see how we can parse the output to create a custom dashboard displaying camera snapshots, Round-Trip Delay (RTD), and SNMP charts. Check out our article about what SNMP is and how it works to learn more.
The API methods of the following examples require some additional configuration. For example agent, device, and SNMP sensor IDs. Make sure you have them ready, you can retrieve them using agent.listAgents, as seen before, device.listDevices and eyes.listEyesSNMP. You can specify the IDs directly in the node’s configuration window or pass them in the input message (e.g., using and injector node with a payload like this {"params": {"agent_id": "123456"}})
How to create an SNMP data chart
You can use SNMP monitoring to remotely monitor all sorts of device and sensor data. In addition, you can use an SNMP data chart for SNMP server room temperature monitoring. You can easily configure Domotz network monitoring software to provide data when SNMP temperature and humidity values rise or fall.
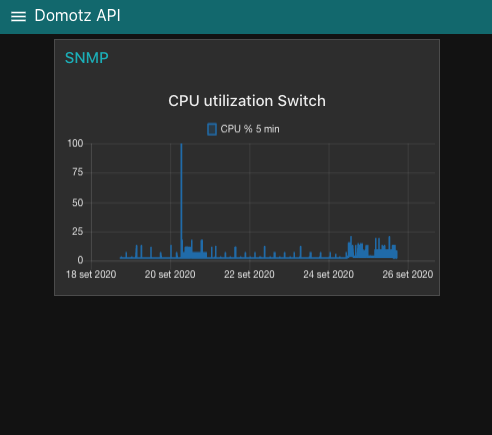
Select eyes.getEyesSNMPHistory, configure it with the right agent, device and sensor ID and connect its main output to a function node to a chart widget. Then connect the function node to a chart widget. The following function code transforms the input data sequence (msg.payload.message) in the format the chart requires:
data = [
    {
        'series': ['CPU % 5 min'],
        'data': [
            [],
        ],
        'labels': ['CPU % 5 min'],
    },
];

dataIn = msg.payload.message;

for (var i = 0; i < dataIn.length; i++) {
    sample = dataIn[i];
    ts = sample.timestamp;
    data[0]['data'][0].push({'x': ts, 'y': sample.value});
}

msg = {
    payload: data,
};

return [msg];
The following images display the wiring and the resulting chart.

How to create a Round Trip Delay chart
Round-Trip delay monitoring helps you measure device response time and packet loss stats. Learn more by reading our guide on Using Round Trip Delay (RTD) to analyze your Wi-Fi Network.
For metrics.getDeviceRTDHistory, you can use a similar approach. The difference is that this time you have three different data series to display: maximum, minimum, and median:
data = [
    {
        'series': ['median', 'min', 'max'],
        'data': [
            [],
            [],
            [],
        ],
        'labels': ['median', 'min', 'max'],
    },
];

dataIn = msg.payload.message;

for (var i = 0; i < dataIn.length; i++) {
    sample = dataIn[i];
    ts = sample.timestamp;
    data[0]['data'][0].push({'x': ts, 'y': sample.median});
    data[0]['data'][1].push({'x': ts, 'y': sample.min});
    data[0]['data'][2].push({'x': ts, 'y': sample.max});
}

msg = {
    payload: data,
};

return [msg];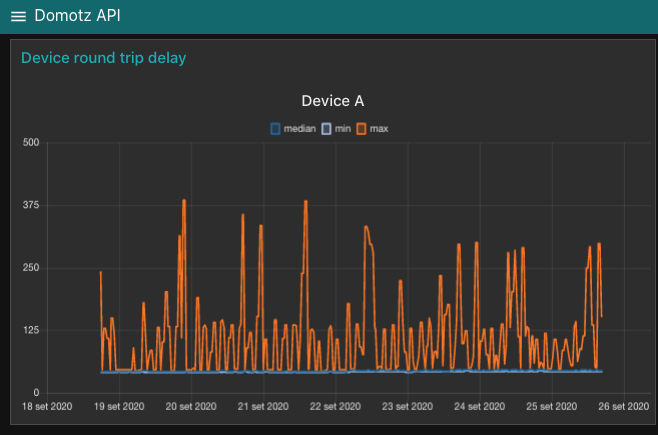
Lights, action…camera! Your custom Node RED Dashboard with security camera footage
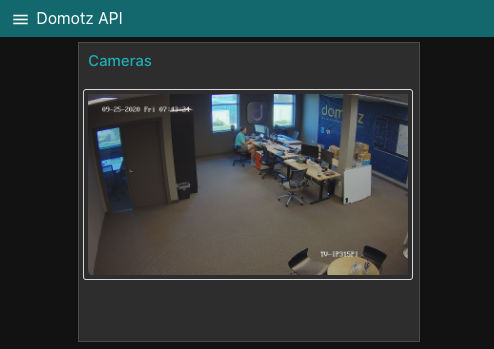
Every custom Node-RED network monitoring dashboard needs Security Camera footage! The multimedia.onvifSnapshot allows you to take a snapshot from an ONVIF camera.
To display the image in our dashboard you don’t need a specific function node. You can perform the data parsing in a template node, which connects directly to the main output of the snapshot node. The following code, (you can add to the template node) waits for a new message, creates a Blob from the binary data, and sets it as the source of an image tag:
<div>
    <style>
        img {
            border: 1px solid #ddd;
            border-radius: 4px;
            padding: 5px;
            width: 400px;
        }
    </style>

    <script>
        (function (scope) {
            scope.$watch('msg', function (msg) {
                if (msg) {
                    var b = new Blob([msg.payload.message], {type: 'image/jpeg'});
                    scope.image = URL.createObjectURL(b);
                }
            });
        })(scope);

    </script>
    <img ng-src="{{image}}"/>
</div>
Your very own Node-RED dashboard example
Now you know how to create your very own Node-RED dashboard. In this tutorial, we’ve seen how to create a custom network monitoring dashboard using data the Domotz API extracts. With little programming effort, the Domotz Node-RED package allows you to interact easily with the Domotz API.
You can also include all kinds of information in your Node-RED dashboards like SNMP sensor data, ONVIF Security Camera snapshots, and Round-Trip delay data. Moreover, there are still many additional things you can add to your custom dashboard. For ideas about what else to include, check out our list of the top 10 IoT devices MSPs are monitoring and managing.
In the next tutorial, we’ll cover how to leverage Domotz Webhooks and the Public API to create automatic responses to network event notifications.
Further reading:
