What is Power BI?

As defined by Microsoft, “Power BI is a unified, scalable platform for self-service and enterprise business intelligence (BI)”. As a business intelligence tool, Power BI allows users to analyze, visualize, and transform raw data into beautiful charts, graphs, and maps from your data. It helps access data from hundreds of sources, allowing organizations to make data-driven decisions. Through Power BI API, users can create personalized dashboards without the need of technical skills or support required. In this way, practically anyone in the organization can easily create beautiful reports and analytics.
Power BI and Domotz
At Domotz, we’ve enabled the possibility to integrate with Power BI to create reports with data extracted from the network. In other words, users can use the Domotz Public API to create custom reports on KPIs like speed tests, RTD information, SNMP sensor charts, network and device status, and more.
Users can create custom reports in Power BI Desktop using the Domotz custom connector. To learn more, please visit our help.
Here, we will go through these topics:
Power BI templates for Domotz
Domotz allows users to create an out-of-the-box Power BI template to help them get insights about the monitored networks. Domotz Power BI templates include six dashboards. If the templates don’t meet your reporting needs, you can customize them whenever you need to.
- Network Highlights
- Network Inventory
- Device Performance
- SNMP/TCP
- Variables
- Applications
Network Highlights
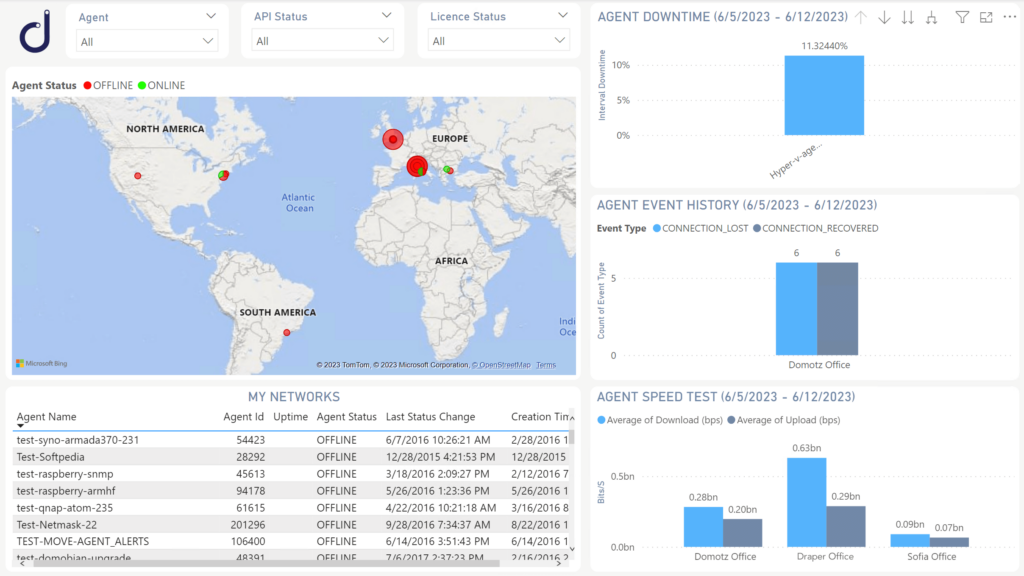
Network Highlights reports data about your Sites. You can clearly see information like current status and location, downtime during the selected period, the average speed test of their networks, and the events registered. In some cases, you will also be able to drill down by time to visualize the downtime events or the historical trend.
Network Inventory
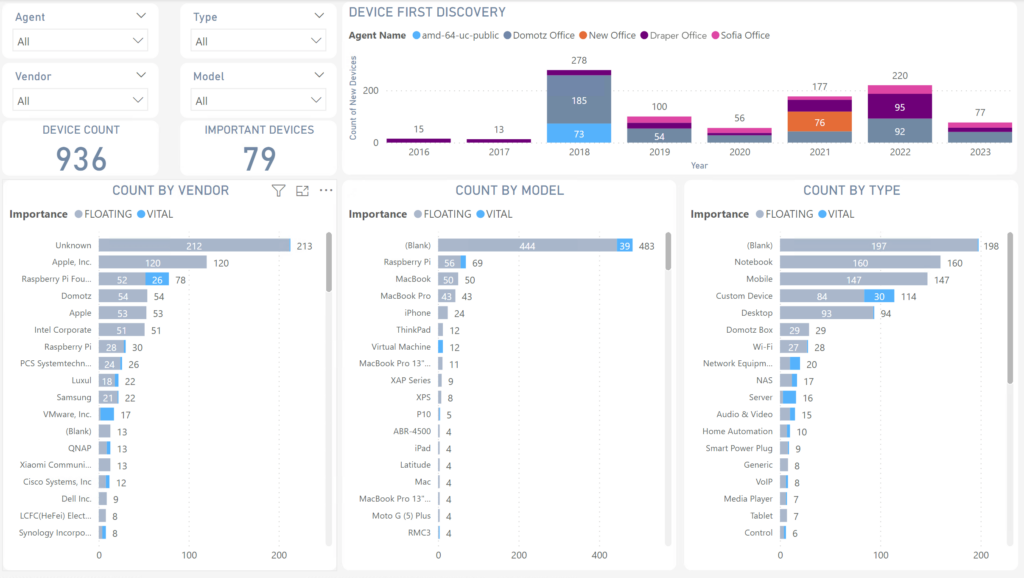
This template is useful and helps you to see the composition of your networks by device vendor, model, and type, distinguished by importance. For instance, the network inventory template will show how many devices were discovered over time, with the possibility of drilling down over time.
Device Performance
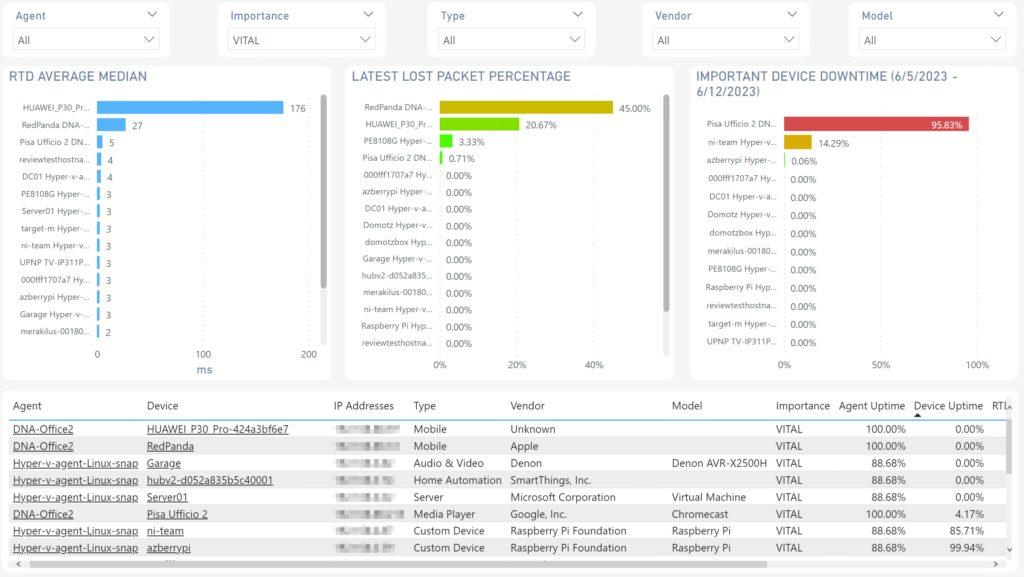
Want to know more about the RTD of specific devices? The “Device Performance” template may help you find out if there is a slow activity. You will also be able to spot which device has lost the most packets in the latest transmission. Another essential information is the downtime of important devices.
If you want to troubleshoot your device in Domotz WebApp, you can do it directly by clicking on the “Device” field in the table. Each device will link you to its page.
SNMP/TCP
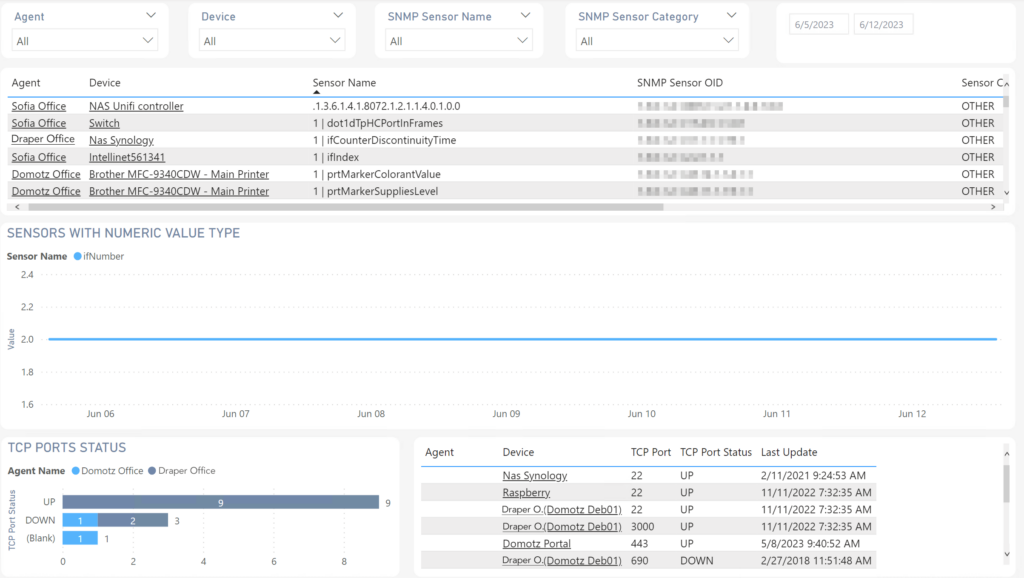
SNMP/TCP will show you data retrieved from your sensors. The latest values are reported in the tables. By looking at the chart, you can see the historical data over time of the numeric value type SNMP sensors.
Variables
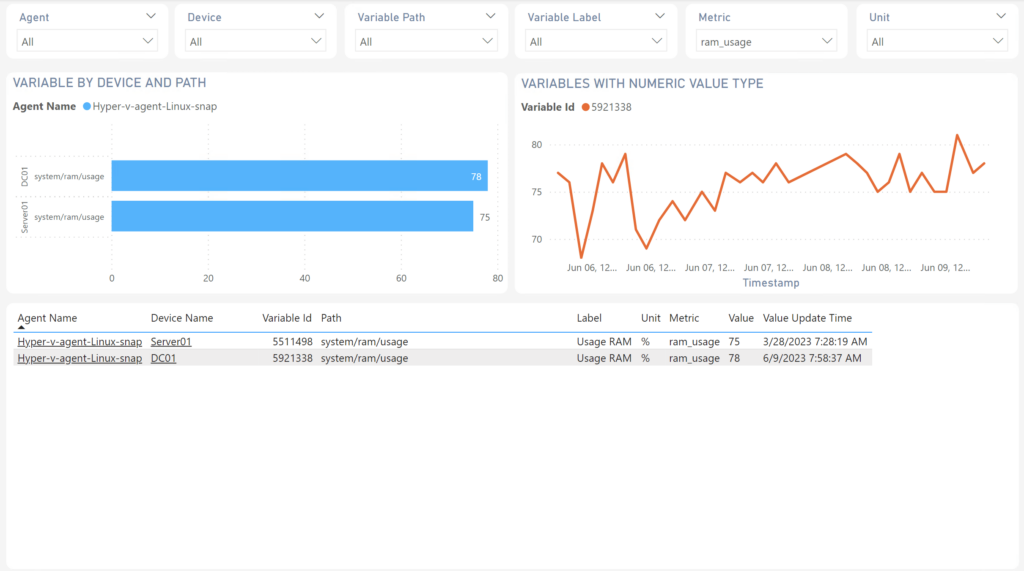
If you use Pre-Configured SNMP Sensors, Custom Integrations, or TCP Sensors, this dashboard allows you to access this information in a single place. Filtering by “Metric” you will be able to see at a glance the free space of all your disks or the RAM usage of all devices along with their historical values.
Another way to investigate interesting data is by using the filter “Unit” which allows you to retrieve more information, for example, about any thermometer sensor, or also select the specific sensors you are interested in by their path or label.
Applications
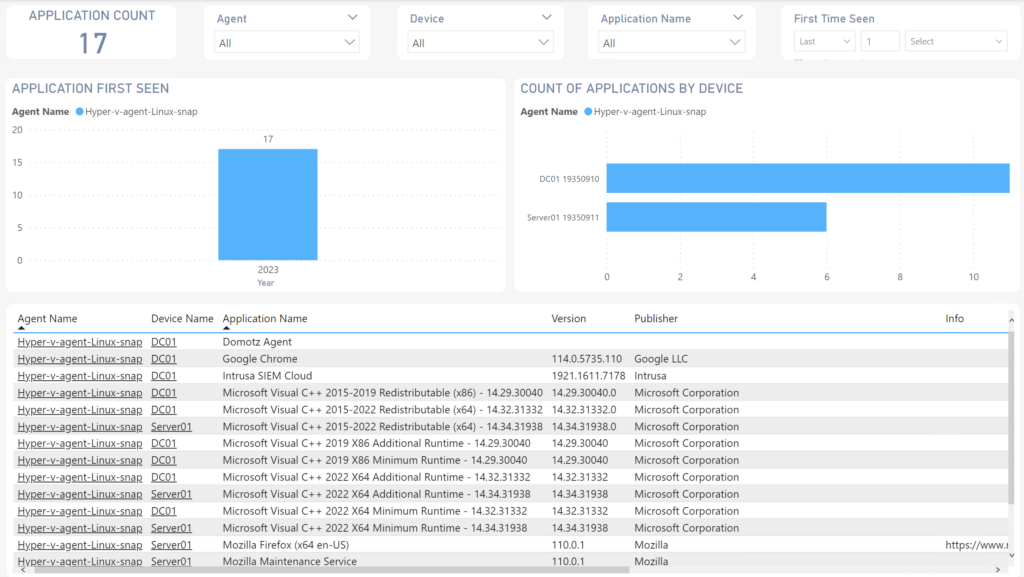
If you unlock the OS monitoring on any device, the result is that, in the “Applications” template, you can see the list of all the applications in your devices, with a visual of when they were discovered. You can drill down in this view to determine when and where you installed the new applications.
The Domotz Power Bi templates want to help you get insights about your monitored networks but can also be customized to meet your reporting needs. If you want to access open source, you’ll find all the information on Github. Every Power BI template, even the Domotz one, can be customized and adapted to fit your needs better.
What is an on-premises Power BI gateway?
Power BI gateway is the software required to access data in an on-premises network. The gateway manages the request if anyone needs to access on-premises data from a cloud or web-based app. The on-premises Power BI gateway provides quick and secure data transfer between data not in the cloud (on-premises data) and several Microsoft cloud services.
Organizations can keep databases and other data sources on their on-premises networks using a gateway, yet securely using that data in cloud services.
Learn more here about what is an on-premises data gateway.
Why use Power BI gateway?
Did you create your report in the Power BI Desktop on your local computer and publish it to the Power BI service?
Power BI gateway allows you to schedule an automatic refresh of your reports or an on-demand refresh.
Visit our help page to learn more about installing, configuring, and using it.
Conclusion
In summary, Power BI is a versatile tool that empowers organizations to gain insights from their data, create visually appealing reports, and make informed decisions. By leveraging the integration with systems like Domotz and utilizing the on-premises Power BI gateway, users can enhance their data analytics capabilities and maximize the value derived from their data.
Want to learn more? Our Power BI integration can show you more.
Further reading: