Every network eventually hits a wall. Traffic grows, applications multiply, users spread across more locations, and the infrastructure that handled everything smoothly last year starts showing strain. The question is whether you find out from a monitoring dashboard or from a flood of user complaints.
Network capacity planning is the discipline that keeps you ahead of that moment. Done well, it turns historical traffic data and growth trends into concrete, defensible decisions about when to upgrade, where to invest, and what can safely wait. Done poorly, or not at all, it produces two equally damaging outcomes: over-provisioned networks with wasted budget, and under-provisioned ones that degrade silently until users make the problem impossible to ignore.
This guide covers the top 10 network capacity planning tools for 2026, what makes each one useful, who each one is built for, and how to evaluate them against your actual operational requirements. The goal is not to hand you a marketing ranking. It is to give you a practical framework for choosing the right tool for your environment.
Table of contents
- Are You Planning for Network Capacity, or Just Guessing?
- Essential Features of Network Capacity Planning Tools
- Quick Comparison: Top 10 Network Capacity Planning Tools for 2026
- The Top 10 Network Capacity Planning Tools for 2026
- How to Choose the Right Network Capacity Planning Tool
- Where Domotz Fits in the Network Capacity Planning Stack
- The Bottom Line on Network Capacity Planning in 2026
- Frequently Asked Questions
Are You Planning for Network Capacity, or Just Guessing?
Most IT teams have some version of capacity planning in place. The problem is that many of those processes are built on incomplete data, infrequent reviews, and reactive triggers. An interface starts dropping packets, a link saturates during business hours, or a new application rolls out and immediately consumes headroom that was not expected. These are not planning failures in isolation. They are symptoms of a process that treats capacity as a one-time calculation rather than a continuous discipline.
The High Cost of Poor Capacity Planning
The financial and operational consequences of poor capacity planning run in both directions. Under-provisioning is the more visible problem. Saturated links produce latency, jitter, and packet loss that degrade application performance, damage user experience, and in environments with real-time communications or transactional workloads, can generate direct revenue impact. Over-provisioning is less dramatic but equally costly. Organizations that habitually over-buy bandwidth and hardware to avoid the risk of saturation are effectively paying a permanent insurance premium for poor data.
The fix is the same in both cases: accurate, continuous data on how your network is performing and how that performance is trending over time. That data is what separates a capacity decision backed by evidence from one backed by instinct.
Key Metrics for Network Capacity Planning
Effective bandwidth capacity planning relies on a consistent set of core metrics. Understanding what each one measures, and why it matters, is the foundation of any meaningful capacity assessment.
- Bandwidth utilization: The percentage of available bandwidth in use on a given link or interface. Sustained utilization above 70 to 80 percent is a common threshold for capacity review. Peaks matter as much as averages.
- Throughput: The actual data successfully transferred across a link over time. Throughput is always lower than the theoretical bandwidth ceiling due to protocol overhead, retransmissions, and hardware constraints. A link running at 90 percent throughput on a 100 Mbps circuit is nearing saturation regardless of what the headline speed suggests.
- Latency: Round-trip time between endpoints. Latency increases under load and indicates congestion before packet loss becomes measurable. Trending latency over time surfaces bottlenecks early.
- Packet loss: The percentage of transmitted packets that fail to arrive. Even sub-one-percent packet loss has measurable impact on TCP throughput and real-time application quality.
- Error rates: Interface-level input and output errors signal hardware issues, misconfigured duplex settings, or physical layer problems that compound under load.
- Traffic composition: Understanding which applications, users, and endpoints are consuming bandwidth is essential for prioritization decisions and upgrade justification.
Essential Features of Network Capacity Planning Tools
Not every monitoring platform that includes bandwidth graphs qualifies as a capacity planning tool. Genuine capacity planning capability requires a specific combination of features that go beyond real-time dashboards.
- Historical data collection and trend analysis: Capacity decisions are made on trends, not snapshots. A tool that retains months of interface utilization data and surfaces consumption trends over time is doing capacity planning work. A tool that only shows current utilization is doing monitoring.
- Bandwidth monitoring and traffic analysis: SNMP-based interface polling provides utilization at the link level. Flow-based monitoring (NetFlow, sFlow, IPFIX) adds application and endpoint visibility. The combination gives you both the volume and the composition of traffic.
- Customizable reporting and dashboards: Capacity data needs to be consumable by different audiences. Engineers need interface-level detail. Managers need trend summaries and utilization percentages against defined thresholds. Executives need cost-impact framing. A good tool supports all three without requiring custom development.
- Threshold-based alerting: Configurable alerts on utilization thresholds give you a consistent, automated trigger for capacity review before users feel the impact. Static thresholds work for simple environments. Baseline-relative alerting handles environments where traffic patterns are seasonal or shift-dependent.
- What-if scenario modeling: Some platforms allow you to model the impact of projected growth or planned infrastructure changes on existing capacity. This is most common in dedicated capacity planning or advanced flow analysis tools, and it elevates the function from reactive monitoring to genuine infrastructure planning.
Quick Comparison: Top 10 Network Capacity Planning Tools for 2026
| Tool | Best For | Deployment | Starting Price | Free Trial |
|---|---|---|---|---|
| Domotz | MSPs and IT teams, multi-site monitoring | Cloud + lightweight agent | $1.50/managed device/month | 14 days |
| SolarWinds NPM | Large enterprise environments | On-premises (Windows Server) | Quote-based | 30 days |
| Paessler PRTG | All-in-one sensor-based monitoring | On-premises or cloud | $2,149/year (500 sensors) | 30 days |
| ManageEngine OpManager Plus | Mid-market with traffic forensics | On-premises (Windows / Linux) | From $245 (25 devices) | 30 days |
| Auvik | MSPs requiring automated mapping | Cloud-native SaaS | Quote-based | 14 days |
| LogicMonitor | Hybrid cloud and enterprise SaaS | SaaS | Quote-based | 14 days |
| Kentik | AI-driven network observability at scale | Cloud SaaS | Quote-based | Contact vendor |
| Nagios XI | Customizable on-premises monitoring | On-premises (Linux) | From $1,995 (Standard) | 60 days |
| Zabbix | Open-source, cost-sensitive environments | On-premises / self-hosted | Free (open source) | N/A |
| WhatsUp Gold | Visual traffic mapping, Windows-centric | On-premises (Windows Server) | Quote-based | 14 days |
Pricing is based on publicly available and community-sourced information and may not reflect current or exact vendor pricing. Always check with the vendor for the latest details.
The Top 10 Network Capacity Planning Tools for 2026
1. Domotz
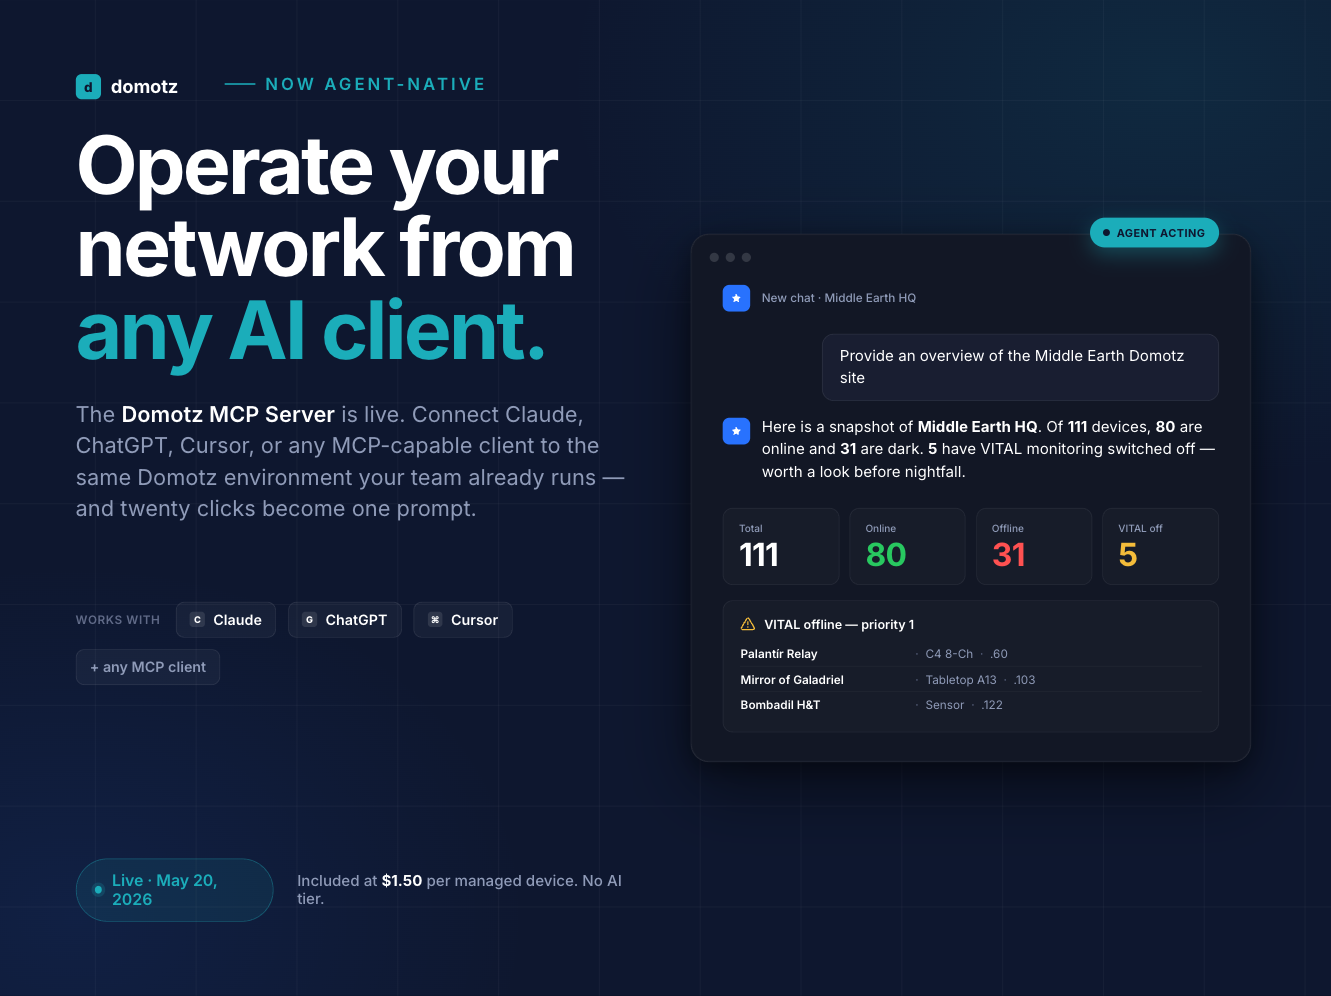
Domotz is a cloud-managed network monitoring and management platform built for MSPs and IT teams that need continuous visibility across distributed, multi-site environments. It deploys through a lightweight agent — available on hardware appliances, Raspberry Pi, Docker, Synology NAS, Windows, and Linux — and connects to the cloud management platform automatically. Most sites are fully operational within 15 to 20 minutes of deployment.
For network capacity planning, Domotz collects the foundational data that planning decisions depend on: SNMP-based interface utilization on managed switches and routers, automated internet speed tests via iPerf3 integration, per-port bandwidth consumption, and historical trending across all monitored interfaces. Threshold-based alerting with configurable severity levels (added in the January 2026 update) lets teams define utilization triggers at the link level and receive prioritized notifications before saturation impacts users. The platform also includes automatic VLAN detection, topology snapshots for point-in-time network state comparison, and topology maps that surface physical and logical relationships across all monitored sites.
Domotz’s pricing model is straightforward: $1.50 per managed device per month, billed in bundles of 10. There are no license tiers, no per-site fees, and no additional charges for collectors or deployment locations. Unmanaged devices receive free discovery, identification, and status visibility. This makes the cost-per-site calculation predictable at any scale.
- Best for: MSPs and IT teams managing distributed networks across multiple client sites who need fast deployment, predictable pricing, and reliable capacity data without enterprise complexity.
- Deployment: Cloud-managed with lightweight on-site agents (hardware or software).
- Pricing: $1.50/managed device/month. 14-day unlimited free trial available.
- Capacity planning strengths: SNMP interface utilization, historical trending, threshold alerting with severity levels, iPerf3 throughput testing, topology snapshots, per-port bandwidth data.
Start a free Domotz trial — no credit card required, fully operational in minutes.
2. SolarWinds Network Performance Monitor (NPM)
SolarWinds NPM is one of the most established enterprise network monitoring platforms on the market. It provides deep SNMP-based monitoring across routers, switches, firewalls, and WAN links, with hop-by-hop path analysis, customizable performance baselines, and advanced capacity planning dashboards. The NetFlow Traffic Analyzer (NTA) module adds flow-based traffic analysis for per-application and per-conversation visibility.
NPM’s capacity reporting includes exhaustion date calculations, interface utilization trending, and the ability to correlate performance data across multiple network layers simultaneously. It is a technically mature platform with broad integration support, including ticketing systems, log management, and cloud platforms.
- Best for: Large enterprise IT teams with dedicated network operations staff, significant infrastructure footprint, and budget to match.
- Deployment: On-premises, Windows Server required.
- Pricing: Quote-based, element-based licensing. Significant investment at enterprise scale. 30-day trial available.
- Capacity planning strengths: Interface exhaustion date calculation, baseline-relative alerting, deep flow analysis with NTA, multi-layer performance correlation.
3. Paessler PRTG
PRTG is a comprehensive infrastructure monitoring platform that covers network devices, servers, applications, cloud services, and IoT from a single Windows-based installation. Its sensor model allows teams to monitor exactly what they need without paying for unnecessary capability. Over 250 pre-built sensor types support SNMP, NetFlow, sFlow, jFlow, IPFIX, WMI, and packet sniffing.
For bandwidth capacity planning, PRTG collects interface-level utilization via SNMP and provides deep traffic composition analysis through its flow sensors. Customizable dashboards, threshold alerts, and scheduled reports support both operational monitoring and longer-term capacity analysis. A free tier covering up to 100 sensors makes it accessible for smaller environments.
- Best for: Mid-market and enterprise environments wanting all-in-one infrastructure monitoring with sensor-level granularity.
- Deployment: On-premises (Windows Server) or cloud.
- Pricing: $2,149/year for 500 sensors; free tier up to 100 sensors. 30-day trial available.
- Capacity planning strengths: 250+ sensor types, NetFlow and sFlow support, SNMP interface monitoring, customizable dashboards, scheduled reporting.
4. ManageEngine OpManager Plus
ManageEngine OpManager Plus bundles network device monitoring with the NetFlow Analyzer module, making it one of the strongest mid-market options for environments that need both fault monitoring and traffic forensics in a single platform. It supports NetFlow, sFlow, J-Flow, IPFIX, and AppFlow, providing per-application, per-user, and per-conversation traffic analysis alongside machine-learning-based capacity planning and anomaly detection.
OpManager’s Discovery Rule Engine automates device configuration during initial setup, reducing the manual overhead that often delays capacity data collection in new deployments. Its capacity planning module produces utilization trends, growth projections, and bandwidth recommendations based on historical traffic data.
- Best for: Mid-market and enterprise teams that need deep flow-based traffic analysis alongside standard network monitoring at a price point below SolarWinds.
- Deployment: On-premises (Windows Server or Linux).
- Pricing: Standard edition from $245 for 25 devices. Enterprise from $11,545 for 250 devices. 30-day trial available.
- Capacity planning strengths: ML-based capacity planning, flow-based traffic analysis, per-application visibility, DDoS anomaly detection, automated growth projections.
5. Auvik
Auvik is a cloud-native SaaS platform designed specifically for MSPs and internal IT teams managing multi-site, complex network environments. It automates network topology mapping, device inventory, and configuration backup, and its TrafficInsights module provides flow-based traffic analysis for bandwidth capacity planning. Auvik’s strength is the speed and accuracy of its automated documentation — topology maps update in real time as devices are added or changed.
For capacity planning, Auvik collects bandwidth utilization data per interface, surfaces traffic trends, and provides application-level visibility through TrafficInsights. It integrates natively with major PSA and RMM platforms, making it a natural fit for MSPs looking to build capacity reporting into service delivery workflows.
- Best for: MSPs that prioritize automated network documentation and topology mapping alongside bandwidth visibility.
- Deployment: Cloud-native SaaS with on-site lightweight collectors.
- Pricing: Quote-based, per-device licensing. 14-day trial available.
- Capacity planning strengths: Automated topology maps, flow-based traffic analysis, application-level visibility, real-time interface utilization.
6. LogicMonitor
LogicMonitor is a SaaS-based infrastructure monitoring platform with strong coverage across hybrid cloud, on-premises, and distributed network environments. Its Edwin AI engine provides anomaly-based alerting that learns normal behavior and surfaces statistically meaningful deviations, reducing alert fatigue while improving early detection of capacity-related issues.
LogicMonitor collects performance data through a distributed collector model, enabling monitoring of devices across geographically distributed networks without requiring VPN tunnels back to a central server. For capacity planning, it provides historical trending, utilization forecasting, and customizable dashboards that support both operational and executive-level reporting.
- Best for: Enterprise organizations managing hybrid cloud infrastructure with a need for AI-assisted anomaly detection and scalable distributed monitoring.
- Deployment: SaaS with distributed collectors.
- Pricing: Quote-based. 14-day trial available.
- Capacity planning strengths: AI-driven anomaly detection, predictive trend analysis, hybrid cloud coverage, distributed collection model.
7. Kentik
Kentik is a cloud-native network observability platform built for environments where traffic volumes and complexity exceed what traditional monitoring tools can handle effectively. It ingests flow data (NetFlow, sFlow, IPFIX, BGP, SNMP) at very large scale and applies behavioral analytics, DDoS detection, and traffic engineering analysis to the collected data. Its query engine allows teams to ask specific questions about traffic behavior and surface answers quickly from large historical datasets.
For bandwidth capacity planning, Kentik provides deep traffic composition analysis, utilization trending, and application-level visibility across multi-cloud and hybrid environments. It is primarily used by large enterprises, service providers, and organizations with significant network operations requirements.
- Best for: Large enterprises, service providers, and network operations teams with high data volumes and complex multi-cloud environments.
- Deployment: Cloud SaaS.
- Pricing: Quote-based. Contact vendor for trial access.
- Capacity planning strengths: Large-scale flow ingestion, behavioral traffic analytics, DDoS detection, BGP visibility, multi-cloud support.
8. Nagios XI
Nagios XI is the commercial edition of the long-running Nagios monitoring platform, built on the open-source Nagios Core engine with a more polished interface, advanced reporting, and capacity planning features. It monitors network services, host resources, and devices through a combination of SNMP, ICMP, and plugins, with a large community-maintained plugin library covering specific devices and protocols.
For capacity planning, Nagios XI supports interface utilization monitoring, trend analysis through its graphing engine, and threshold-based alerting. It runs on Linux and requires more manual configuration than commercial SaaS alternatives, making it better suited to technical teams comfortable with on-premises infrastructure management.
- Best for: Technical teams that need a customizable, on-premises monitoring platform with full control over configuration and alerting.
- Deployment: On-premises (Linux).
- Pricing: Standard edition from $1,995. Enterprise edition from $3,495. 60-day trial available.
- Capacity planning strengths: Extensive plugin ecosystem, SNMP interface monitoring, historical trending, threshold alerting, highly customizable.
9. Zabbix
Zabbix is an open-source enterprise-level monitoring platform that provides real-time data collection, customizable dashboards, and a powerful alerting and trigger system. It supports SNMP, ICMP, agent-based monitoring, and flow data through integration, and its template system allows teams to standardize monitoring configurations across large device estates.
For capacity planning, Zabbix collects historical performance data, supports trend forecasting, and can be configured with multi-condition triggers that correlate interface utilization, error rates, and protocol-level signals into capacity-relevant alerts. It requires substantial investment in initial configuration and ongoing maintenance, but for organizations with the technical staff to manage it, it delivers enterprise monitoring capability at no license cost.
- Best for: Organizations with strong internal technical expertise and a preference for open-source infrastructure.
- Deployment: On-premises or self-hosted. Available as appliance, packages, or containers.
- Pricing: Open source and free. Commercial support available from Zabbix LLC.
- Capacity planning strengths: SNMP interface monitoring, historical trending, configurable forecasting, flexible trigger logic, no license cost.
10. WhatsUp Gold
WhatsUp Gold is a network monitoring platform from Progress Software that provides device availability monitoring, bandwidth analysis, and visual network mapping in a Windows Server environment. The Network Traffic Analysis add-on extends the base platform with flow-based monitoring (NetFlow, sFlow, jFlow, IPFIX), enabling per-application and per-conversation bandwidth analysis for capacity planning purposes.
WhatsUp Gold produces clear, visual traffic maps and customizable reports that make it accessible to IT managers who need to communicate capacity status to non-technical stakeholders. Its strength is usability; it is generally faster to configure and report from than heavier enterprise platforms.
- Best for: Mid-market organizations on Windows infrastructure that want visual traffic mapping and accessible reporting for capacity planning.
- Deployment: On-premises (Windows Server).
- Pricing: Quote-based, perpetual or subscription licensing. 14-day trial available.
- Capacity planning strengths: Visual network maps, flow-based traffic analysis add-on, historical bandwidth reports, accessible UI for non-specialist users.
How to Choose the Right Network Capacity Planning Tool
The right tool depends less on which platform has the longest feature list and more on how well it fits your team’s operational model, your infrastructure complexity, and your budget constraints. Here are the evaluation criteria that matter most in practice.
Scale and architecture: Cloud-native tools like Domotz, Auvik, and LogicMonitor deploy faster and scale more predictably across distributed networks than on-premises platforms. If you manage 10 or more separate sites, cloud-managed monitoring with lightweight agents eliminates the infrastructure overhead of maintaining monitoring servers at each location.
Traffic analysis depth: SNMP-based tools provide interface-level utilization, which is sufficient for most capacity planning decisions. Flow-based tools (PRTG, ManageEngine, SolarWinds NTA, Kentik) add application and user-level visibility, which is necessary for environments where traffic composition — not just volume — drives planning decisions. Domotz delivers SNMP-based interface utilization and per-port bandwidth data, which covers most MSP and mid-market capacity planning requirements effectively.
Budget and pricing model: Enterprise platforms carry enterprise pricing. SolarWinds, LogicMonitor, and Kentik are calibrated for large organizations with dedicated IT operations budgets. PRTG’s sensor model provides flexibility but can scale unpredictably in large environments. Domotz’s per-device model with no per-site fees is consistently the most cost-predictable option for MSPs managing many sites.
Team expertise: Nagios XI and Zabbix deliver significant capability at lower license cost, but they require technical staff who can configure, maintain, and extend the platform. If that expertise is available, both are strong options. If it is not, the operational overhead of managing an open-source platform will offset the license savings.
Reporting audience: Capacity planning data needs to reach multiple audiences. Engineers need interface-level detail. Managers and executives need trend summaries with business-impact framing. Look for tools that support both levels of reporting without requiring significant manual work to produce each.
Where Domotz Fits in the Network Capacity Planning Stack
Domotz is not a dedicated capacity planning platform in the way that a purpose-built flow analyzer might be. What it does is provide the foundational data layer that network capacity planning depends on: continuous interface utilization monitoring via SNMP, historical performance data, threshold-based alerting with configurable severity levels, automated device discovery and topology mapping, and iPerf3-based active throughput testing across sites.
For MSPs and IT teams managing distributed multi-site environments, that combination covers the majority of practical capacity planning requirements. You can identify which links are trending toward saturation, which sites are approaching their provisioned bandwidth ceilings, and which device groups are showing consistent utilization growth — all from the same platform you use for fault monitoring, remote access, and device management.
The January 2026 update added topology snapshots and automatic VLAN detection, which strengthens the platform’s usefulness for network state comparison over time. The bulk alerting capability released in 2025 allows MSPs to configure utilization thresholds across devices and sites in minutes rather than hours, which is critical when managing large multi-client environments.
Where Domotz does not cover the full capacity planning scope is in deep flow-based application visibility. If your planning decisions require per-application, per-user, or per-conversation traffic analysis, pairing Domotz with a dedicated flow analyzer or a platform like ManageEngine NetFlow Analyzer will close that gap. For most MSP environments, SNMP-level interface monitoring plus active throughput testing provides sufficient data for actionable capacity decisions.
Explore Domotz features or start a free 14-day trial to see what visibility looks like across your own network.
The Bottom Line on Network Capacity Planning in 2026
Network capacity planning is not a project you complete once and revisit annually. It is an ongoing operational discipline that depends on consistent data collection, regular trend review, and timely decision-making before users feel the impact of constrained infrastructure.
The tools in this guide cover the full spectrum from open-source platforms that require significant manual effort to enterprise SaaS solutions built for large-scale operations. The right choice depends on your environment’s scale, your team’s technical capacity, your budget, and how much of the capacity planning workflow you need the tool to automate.
For MSPs and IT teams that need reliable, multi-site bandwidth visibility without the deployment complexity or unpredictable cost scaling of enterprise tools, Domotz provides a practical starting point. It deploys in minutes, collects the data that capacity planning decisions require, and scales across as many sites and devices as your environment demands.
Start your free Domotz trial today and move from reactive fire-fighting to proactive network management.
Frequently Asked Questions
The goal of network capacity planning is to ensure your network infrastructure can support current and future traffic demands without degraded performance. It involves collecting historical utilization data, identifying growth trends, and making informed decisions about when and where to upgrade bandwidth, hardware, or architecture before constraints affect users or applications.
Network capacity is calculated by comparing available bandwidth on each link or interface against actual throughput over time. Start with SNMP polling to collect interface utilization data. Calculate peak and average utilization as a percentage of provisioned bandwidth. Layer in growth rate trends from historical data to project when a given link will reach your defined saturation threshold, typically 70 to 80 percent sustained utilization. This gives you a data-based timeline for upgrade planning.
The core metrics are bandwidth utilization (percentage of available bandwidth in use), throughput (actual data transferred), latency (round-trip time, which increases under congestion), packet loss (a direct performance impact indicator), interface error rates (which compound under load), and traffic composition (which applications and users are generating the traffic). Together, these metrics give you both the volume and the nature of demand on each network segment.
Capacity planning should be a continuous process supported by automated monitoring, not a periodic manual exercise. Real-time monitoring with threshold-based alerting catches immediate saturation risks. Weekly or monthly trend reviews identify growth patterns before they become crises. Formal capacity reviews tied to budget cycles or significant infrastructure changes ensure planning data informs investment decisions at the right time.
Performance monitoring tracks how your network is operating right now: whether devices are up, whether links are saturated, whether latency has spiked. Capacity planning uses that same data over time to forecast future requirements. Performance monitoring is reactive by nature. Capacity planning uses monitoring data to become proactive. A good network capacity planning tool does both: it monitors performance continuously and retains enough historical data to support trend analysis and forward planning.
Yes. Domotz monitors bandwidth utilization through SNMP interface polling and automated speed tests, tracks per-port consumption on managed switches, retains historical performance data for trend analysis, and supports threshold-based alerting with configurable severity levels. For MSPs and IT teams managing multi-site environments, Domotz provides the foundational data layer that network capacity planning decisions depend on. For environments requiring deep flow-based application visibility, Domotz can complement a dedicated flow analyzer.
Bandwidth capacity planning is the process of measuring, trending, and forecasting bandwidth consumption to ensure network links remain within acceptable utilization thresholds. It involves collecting utilization data at regular intervals, identifying peak periods and growth rates, and using that information to determine when provisioned bandwidth needs to be increased. It is a specific subset of broader network capacity planning that focuses on link and interface utilization rather than device resources or application performance.