Network performance problems rarely announce themselves. A switch port saturates. A WAN link starts dropping packets. A critical server stops responding to polling. By the time a user files a ticket, the damage is already done. The protocols your monitoring system uses decide how fast you see the problem, how clearly you can diagnose it, and whether you can fix it before it becomes a business issue.
This guide ranks the most important network monitoring protocols used in 2026, explains what each one does well, and reviews the top network performance monitoring tools that implement them. The focus is practical. If you run networks for a living, you need to know which protocols to deploy, which tools support them cleanly, and where each vendor fits in a real MSP or IT environment.
By the end, you will have a clear framework for picking the right protocol for each monitoring job and the right tool to run it at scale.
Table of contents
- What is network performance monitoring?
- Top network monitoring protocols explained
- How we evaluated these network monitoring tools
- Network monitoring tools at a glance
- 2. SolarWinds Network Performance Monitor
- 3. PRTG Network Monitor
- 4. ManageEngine OpManager
- 5. Auvik
- 6. Nagios
- 7. Zabbix
- 8. LogicMonitor
- 9. ManageEngine NetFlow Analyzer
- 10. Progress WhatsUp Gold
- How to choose the right network monitoring protocol
- Conclusion
- Frequently asked questions
- What is network performance monitoring?
- How does SNMP work in network monitoring?
- What are the best protocols for network performance monitoring?
- How can MSPs benefit from network monitoring protocols?
- What is the difference between SNMP and NetFlow?
- How do you choose the right network monitoring tool?
- Are agentless protocols better than agent-based monitoring?
- Is SNMP v3 secure enough for production networks?
What is network performance monitoring?
Network performance monitoring is the continuous measurement of how a network is carrying traffic, how devices are behaving, and how end users are experiencing services. It covers metrics like latency, jitter, packet loss, throughput, interface utilization, device CPU and memory, and service availability. The goal is simple: catch degradation before users feel it, and give engineers the data they need to fix it fast.
Performance monitoring is different from fault monitoring. Fault monitoring answers the question “is it up?” Performance monitoring answers the harder question “is it working well enough?” A switch can be up while a single uplink is dropping 5% of frames. That packet loss is what kills a Teams call or a VoIP conversation. Protocols are how monitoring tools see inside the network to find this kind of problem. There are various network monitoring tools that can help in assessing the problems.
Top network monitoring protocols explained
Every performance monitoring platform relies on a handful of well-established protocols to collect data. Here are the seven that matter most in 2026.
SNMP (Simple Network Management Protocol)
SNMP is the universal language of network device monitoring. It polls switches, routers, firewalls, servers, printers, UPS units, and almost any other enterprise-grade device for metrics exposed through MIBs (Management Information Bases). SNMP v3 adds authentication and encryption, which you should use wherever possible. SNMP v2c is still common but sends community strings in cleartext. Most monitoring tools support all three versions (v1, v2c, and v3). Use SNMP for interface utilization, CPU load, memory usage, environmental sensors, and anything else the vendor exposes in a MIB.
SNMP is also the primary protocol behind most VPN gateway monitoring, for a detailed comparison of tools that leverage SNMP to track tunnel status and session counts, see our guide to the top VPN monitoring software for 2026.
ICMP (ping and traceroute)
ICMP is the simplest and most widely deployed protocol for reachability and round-trip time measurement. Ping tells you a device is responding. Traceroute (or MTR) tells you the path traffic is taking and where latency is being introduced. Modern monitoring platforms run continuous ICMP probes at 30-second to 5-minute intervals and graph round-trip delay and packet loss over time. Use ICMP for liveness checks, latency baselines, and WAN path quality monitoring.
NetFlow, sFlow, IPFIX, and J-Flow
Flow protocols export metadata about every conversation crossing a network device. A flow record typically includes source IP, destination IP, port, protocol, byte count, and packet count. NetFlow is the Cisco-originated standard, IPFIX is its IETF-standardized successor, sFlow is the sampling-based alternative used by many non-Cisco vendors, and J-Flow is Juniper’s variant. Use flow protocols for bandwidth analysis, application identification, top-talker reporting, and detecting unusual traffic patterns. Flow data is how you answer “who is saturating this link, and with what?”
Syslog
Syslog is the standard protocol for event and log message forwarding from network devices to a central collector. Switches log link state changes, firewalls log policy hits, routers log BGP events. Aggregating syslog centrally is essential for root cause analysis and for security correlation. Use syslog alongside SNMP, not as a replacement. SNMP tells you what a counter is reading. Syslog tells you what just happened on the device.
WMI and WinRM
Windows Management Instrumentation and Windows Remote Management are Microsoft’s protocols for deep visibility into Windows servers and workstations. They expose OS-level metrics that SNMP cannot reach: service status, process lists, event logs, disk performance counters, and patch state. Monitoring platforms use WMI or WinRM for Windows-specific performance data that matters to application health.
SSH, API, and custom scripts
For any metric a vendor has not exposed over SNMP, the fallback is SSH command-line collection, vendor-specific REST APIs, or custom scripts. Modern monitoring platforms let you define scripts that log into a device, run a command, parse the output, and graph the result. This is how you monitor things like firewall tunnel counts, wireless controller client counts, and hypervisor cluster status. Flexible script support separates full-featured monitoring platforms from basic tools.
TCP port monitoring
TCP port monitoring verifies that specific services are answering on their expected ports. HTTP on 443, SSH on 22, RDP on 3389, a database on 5432. This is a lightweight but important check because a server can respond to ping while its critical service is down. Use TCP checks as a cheap way to verify application-layer availability before layering on deeper protocol-specific tests.
How we evaluated these network monitoring tools
Every tool in this guide was evaluated against four criteria drawn from real MSP and IT team requirements.
Protocol breadth. The tool must support the core protocols above, with strong SNMP v1, v2c, and v3 implementations as a baseline and credible flow, syslog, and script capabilities.
Real-time visibility. The tool must poll frequently enough to catch short-lived performance issues and surface them through alerts and dashboards without heavy manual configuration.
Deployment and scale fit. Cloud-native tools favor multi-site MSPs. On-premises tools favor single-enterprise networks with strict data residency requirements. Both are valid; the fit matters.
Cost and licensing clarity. Per-device, per-sensor, per-element, and quote-based models each have tradeoffs. Transparent pricing and predictable scaling matter, especially for MSPs billing customers per site.
Network monitoring tools at a glance
| Tool | Best for | Key protocols | Starting price | Deployment |
| Domotz | MSPs and multi-site IT teams | SNMP v1/v2/v3, ICMP, TCP, SSH, WMI, custom scripts | $1.50 per managed device per month | Cloud with on-prem collector |
| SolarWinds NPM | Large enterprise infrastructure | SNMP, NetFlow, ICMP, WMI, syslog | From approximately $2,995 per year | On-prem or SaaS |
| PRTG Network Monitor | Small to mid-size IT teams | SNMP, NetFlow, sFlow, WMI, ICMP, syslog | Free up to 100 sensors, paid from approximately $2,149 | On-prem or hosted |
| ManageEngine OpManager | On-prem mid-size IT teams | SNMP, ICMP, WMI, CLI, syslog | From approximately $245 per year for 10 devices | On-prem |
| Auvik | MSPs focused on documentation | SNMP, ICMP, syslog, CLI | Quote-based, community-reported $150 to $300 per month for 50 devices | Cloud with on-prem collector |
| Nagios | Open-source and plugin-driven shops | SNMP, ICMP, plugin-based for all others | Free Core; Nagios XI from approximately $2,595 per 100 nodes | On-prem |
| Zabbix | Technical teams wanting full control | SNMP, ICMP, IPMI, JMX, agent, scripts | Free, open-source | On-prem or cloud |
| LogicMonitor | Hybrid cloud observability | SNMP, NetFlow, WMI, syslog, API | Custom pricing, reported $16 to $53 per unit per month | SaaS |
| ManageEngine NetFlow Analyzer | Bandwidth and flow analysis | NetFlow, sFlow, IPFIX, J-Flow | From approximately $595 per year | On-prem |
| Progress WhatsUp Gold | Visual, topology-first teams | SNMP, WMI, NetFlow, ICMP | From approximately $2,740 per year | On-prem |
Pricing is based on publicly available and community-sourced information and may not reflect current or exact vendor pricing. Always check with the vendor for the latest details.d custom scripting in a single per-device subscription.
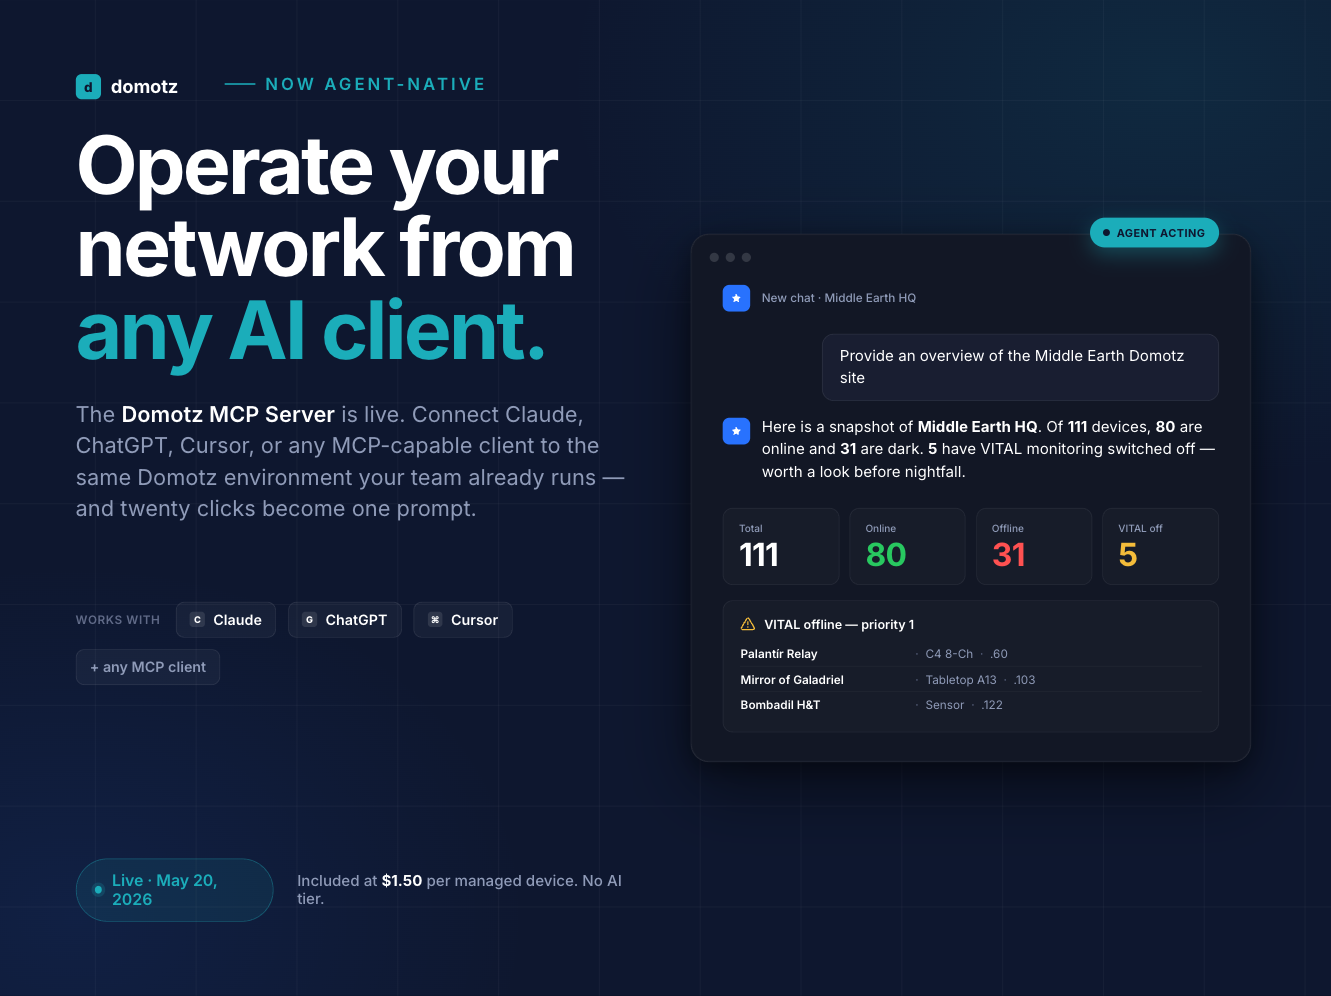
1. Domotz
The platform deploys in under 15 minutes using a lightweight collector that runs on existing hardware, a virtual machine, a NAS, or the Domotz Box. Once deployed, Domotz discovers every device on the network, identifies its make and model, and applies pre-configured SNMP templates where available. Engineers can extend coverage with the built-in MIB browser, custom SNMP/TCP sensors, and scripted monitoring for anything a vendor has not pre-built. For full protocol detail, see the Domotz SNMP monitoring feature page.
- Best for: MSPs, internal IT teams, and AV integrators monitoring multiple sites who need strong SNMP support, secure remote access, and predictable per-device pricing.
- Pricing: $1.50 per managed device per month, billed in bundles of 10 devices ($15 per month minimum). 14-day free trial with no credit card required. Unmanaged devices are discovered and identified at no cost.
- Deployment: Cloud-hosted console with a lightweight on-premises collector. Over 25 deployment options including Windows, Linux, NAS appliances, virtual machines, and the Domotz Box.
- Strengths: Transparent per-device pricing, agentless discovery, SNMP v1/v2c/v3 with pre-configured templates for printers, UPS, NAS, switches, firewalls, and Wi-Fi equipment, integrated MIB browser, custom monitoring templates, remote access to any device without VPN, strong PSA and RMM integrations.
2. SolarWinds Network Performance Monitor
SolarWinds NPM is one of the most established network performance monitoring platforms on the market and a common choice in large enterprise environments. It provides deep SNMP polling, NetFlow analysis through the separately licensed NTA module, topology mapping, and a well-developed alerting engine. NPM is typically deployed on-premises, though SolarWinds now offers a SaaS observability tier as well.
The tradeoff with SolarWinds is licensing complexity. NPM is sold on an element-based model where nodes, interfaces, and volumes each count toward your element total. Advanced capabilities like NetFlow analysis, configuration management, and application monitoring require additional licenses. For teams with the budget and infrastructure to run it properly, NPM delivers enterprise-grade depth.
- Best for: Large enterprises with dedicated network teams and existing on-prem infrastructure.
- Pricing: From approximately $2,995 per year for smaller element counts, scaling into five figures for typical deployments. Community-reported.
- Deployment: On-prem or SaaS (SolarWinds Observability).
- Strengths: Deep SNMP implementation, mature NetFlow analysis through NTA, strong topology visualization, extensive community and integration ecosystem.
3. PRTG Network Monitor
PRTG from Paessler is known for its flexible sensor-based model. Each metric on a device is a sensor: a port, a CPU reading, a disk volume, a flow exporter. PRTG supports SNMP, WMI, NetFlow, sFlow, ICMP, syslog, and custom scripts through a large library of pre-built sensor types.
The pricing model is both a strength and a weakness. The free tier covering 100 sensors is genuinely useful for small environments and makes PRTG a popular entry point. At scale, sensor counts add up quickly, and costs can become difficult to predict. Teams that value a clean GUI and fast setup often choose PRTG despite this.
- Best for: Small to mid-size IT teams with a mix of device types.
- Pricing: Free up to 100 sensors. Paid tiers from approximately $2,149 for 500 sensors. Community-reported.
- Deployment: On-prem or PRTG Hosted Monitor (cloud).
- Strengths: Broad protocol coverage in one product, strong sensor library, clean interface, useful free tier.
4. ManageEngine OpManager
ManageEngine OpManager is a device-based network monitoring platform that supports SNMP, ICMP, WMI, CLI, and syslog out of the box. It is positioned for mid-size IT teams that want on-premises control and a single pane of glass across network, server, and application layers. OpManager’s device-based licensing means all metrics on a single device are covered by one license, which can be more predictable than sensor-based alternatives for large device counts.
OpManager’s add-on modules extend into NetFlow analysis (through NetFlow Analyzer), firewall log analysis, and configuration management. Teams already running other ManageEngine products often standardize on this stack for integration simplicity.
- Best for: Mid-size on-prem IT teams.
- Pricing: From approximately $245 per year for 10 devices. Community-reported.
- Deployment: On-prem.
- Strengths: Device-based licensing, broad protocol support, tight integration with other ManageEngine products, free tier for up to three devices.
5. Auvik
Auvik is a cloud-based network monitoring platform focused on MSPs, with a strong emphasis on automated network documentation and topology mapping. It uses SNMP for device monitoring and CLI access for configuration visibility, and delivers these through an MSP-friendly multi-tenant console.
Auvik’s documentation automation is a legitimate differentiator. Topology maps update continuously as the network changes, and device configuration backups happen automatically. The tradeoff is cost and pricing transparency. Auvik is quote-based per device, and community-reported figures put it at a higher effective per-device cost than several alternatives in this list. For a direct comparison, see Domotz versus Auvik.
- Best for: MSPs that prioritize automated documentation and topology visualization.
- Pricing: Quote-based. Community-reported ranges from $150 to $300 per month for roughly 50 devices.
- Deployment: Cloud with on-prem collector.
- Strengths: Automated topology mapping, strong documentation workflows, multi-tenant MSP console, solid SNMP coverage for core device types.
6. Nagios
Nagios is the long-standing open-source monitoring platform that still anchors many IT teams. Nagios Core is free and plugin-driven. Its protocol support is effectively unlimited because the plugin ecosystem covers SNMP, ICMP, HTTP, TCP, database protocols, and almost anything else. Nagios XI is the commercial version with a polished GUI and supported distribution.
Nagios rewards technical teams. It is powerful but requires real expertise to configure and maintain. For teams with Linux skill and a preference for full control, Nagios remains a strong choice, especially in environments where custom monitoring is the norm.
- Best for: Technical teams with Linux expertise and custom monitoring requirements.
- Pricing: Nagios Core is free. Nagios XI starts at approximately $2,595 per 100 nodes. Community-reported.
- Deployment: On-prem.
- Strengths: Open-source, enormous plugin library, highly customizable, active community.
7. Zabbix
Zabbix is a fully open-source monitoring platform with native support for SNMP, ICMP, IPMI, JMX, and its own lightweight agent. It covers network, server, application, and cloud monitoring in a single product with no licensing fees. The Zabbix community maintains templates for thousands of device types, and Zabbix SIA offers paid support subscriptions for teams that want a safety net.
Zabbix is powerful but has a steep learning curve. Initial setup and template tuning take time, and the UI is functional rather than elegant. For teams willing to invest in the platform, Zabbix delivers enterprise-grade monitoring at zero license cost.
- Best for: Technical teams that want full control and no license cost.
- Pricing: Free, open-source. Paid support and Zabbix Cloud available.
- Deployment: On-prem or cloud (self-hosted or Zabbix Cloud).
- Strengths: No license fees, strong template ecosystem, flexible architecture, active development.
8. LogicMonitor
LogicMonitor is a SaaS observability platform that covers network, server, cloud, and application monitoring in one product. It supports SNMP, NetFlow, WMI, syslog, and API-based data collection through a large DataSource library. LogicMonitor is positioned for hybrid environments where infrastructure spans on-prem and multiple clouds.
The platform leans on AIOps features for anomaly detection and forecasting, which appeal to larger operations teams. LogicMonitor’s pricing is custom and based on Hybrid Units, which makes direct comparison difficult. For teams evaluating both, see Domotz versus LogicMonitor.
- Best for: Mid-to-large enterprises with hybrid infrastructure.
- Pricing: Custom. Community-reported $16 to $53 per Hybrid Unit per month.
- Deployment: SaaS with on-prem Collectors.
- Strengths: Unified observability, large DataSource library, AIOps features, strong cloud and hybrid support.
9. ManageEngine NetFlow Analyzer
NetFlow Analyzer is a focused flow-analysis tool rather than a general-purpose monitoring platform. It ingests NetFlow, sFlow, IPFIX, J-Flow, and other flow formats from network devices and turns them into bandwidth reports, top-talker analysis, application identification, and anomaly detection. For teams that already have general monitoring in place but need deeper flow visibility, NetFlow Analyzer fills that specific gap.
It is most commonly paired with OpManager or used standalone by network teams who care specifically about bandwidth and traffic patterns.
- Best for: Teams that need dedicated flow analysis alongside another monitoring tool.
- Pricing: From approximately $595 per year. Community-reported.
- Deployment: On-prem.
- Strengths: Comprehensive flow protocol support, deep traffic analytics, reasonable entry price, integrates with other ManageEngine products.
10. Progress WhatsUp Gold
WhatsUp Gold from Progress Software is a visual-first network monitoring platform with a reputation for clean topology maps and straightforward alerting. It supports SNMP, WMI, NetFlow (as an add-on), and ICMP. WhatsUp Gold is typically chosen by teams that value visualization and want a single-vendor on-prem platform for network and server monitoring.
The licensing model is modular. Core network monitoring is the base license, and capabilities like flow monitoring, configuration management, and application performance are add-ons. Overall pricing sits in the mid-range for the category.
- Best for: Mid-size teams that value topology visualization and a modular on-prem platform.
- Pricing: From approximately $2,740 per year. Community-reported.
- Deployment: On-prem.
- Strengths: Strong topology visualization, modular licensing, mature alerting engine, Windows-friendly deployme
- 1. Domotz
- Domotz is a cloud-based network monitoring and management platform built for MSPs, IT teams, and technical service providers who need deep protocol support without the complexity of traditional enterprise tools. Domotz combines agentless device discovery, SNMP monitoring across versions 1, 2c, and 3, ICMP-based network diagnostics, TCP port monitoring, annt.
How to choose the right network monitoring protocol
The short version: use multiple protocols. No single protocol gives you full network visibility. The strongest monitoring deployments combine SNMP for device metrics, ICMP for reachability and latency, flow protocols for bandwidth analysis, syslog for event correlation, and scripts or APIs for everything else.
When choosing a tool, match the protocol mix to your environment. If you run a pure-enterprise campus with Cisco gear, deep NetFlow and SNMP matter most. If you run a multi-site MSP with diverse customer hardware, agentless discovery and strong SNMP template coverage matter more than flow depth. If your team spans on-prem and public cloud, look for a platform with API-based collectors alongside traditional protocols.
Three quick questions will narrow your choices fast:
- How many sites and devices are you monitoring, and how will that scale over 12 to 24 months?
- Do your engineers need to troubleshoot remotely, or are they physically at the site?
- Is your pricing tolerance per-device, per-sensor, per-element, or quote-based?
The answers will eliminate most of the shortlist on their own. For deeper reading on how monitoring fits into your broader security posture, see the Domotz network security overview. For a detailed SNMP-specific tools comparison, see the top 12 SNMP monitoring tools for IT teams in 2026.
Conclusion
Network performance monitoring is a protocol problem before it is a tool problem. SNMP, ICMP, NetFlow, syslog, WMI, and custom scripts each answer a different question about your network. The strongest monitoring platforms combine them into a single view and add clear alerting, remote troubleshooting, and pricing that scales predictably.
Domotz is built for teams that want deep protocol coverage without enterprise complexity. SNMP v1/v2c/v3 with pre-configured templates, ICMP-based network diagnostics, TCP port monitoring, custom scripts, and agentless discovery are all included at $1.50 per managed device per month. Deployment takes under 15 minutes, and the 14-day trial requires no credit card.
Start your free 14-day Domotz trial and see every protocol in action on your own network.
Frequently asked questions
What is network performance monitoring?
Network performance monitoring is the continuous measurement of how a network is carrying traffic and how devices are behaving. It tracks metrics like latency, jitter, packet loss, bandwidth utilization, device CPU and memory, and interface errors. The goal is to catch performance degradation before it affects users, and to give engineers enough data to find and fix the root cause quickly. It relies on protocols like SNMP, ICMP, NetFlow, syslog, and WMI to collect data from network devices and servers.
How does SNMP work in network monitoring?
SNMP works by having a monitoring server poll network devices at regular intervals. Each device exposes a set of metrics through Management Information Bases (MIBs), identified by numeric OIDs (object identifiers). The monitoring server sends a GET request for specific OIDs, the device responds with the current values, and the monitoring system stores and graphs the results. Devices can also send unsolicited SNMP trap messages when specific events occur. SNMP v3 adds authentication and encryption; v1 and v2c send data in cleartext and should only be used on trusted network segments.
What are the best protocols for network performance monitoring?
The best protocol depends on the metric you need. SNMP is the universal choice for device-level metrics like CPU, memory, interface utilization, and environmental sensors. ICMP is best for reachability and round-trip latency measurement. NetFlow, sFlow, and IPFIX are best for bandwidth analysis and identifying which applications are consuming a link. Syslog is best for event logs and change tracking. WMI is best for deep Windows server visibility. Most real monitoring deployments combine four or five of these protocols.
How can MSPs benefit from network monitoring protocols?
MSPs benefit from strong protocol support in three ways. First, comprehensive SNMP coverage means fewer customer-specific device types fall outside monitoring, which reduces blind spots. Second, protocols like ICMP and flow export enable proactive detection of performance issues before customers open tickets, which improves SLA performance. Third, broad protocol support reduces truck rolls because engineers can diagnose most issues remotely using the data their monitoring platform is already collecting. For MSPs, this combination directly improves margin per site.
What is the difference between SNMP and NetFlow?
SNMP and NetFlow answer different questions. SNMP tells you what a counter on a device currently reads: interface utilization is 72%, CPU is 48%, memory is 4.2 GB used. NetFlow tells you who is using that interface: a source IP, a destination IP, a port, a byte count per conversation. SNMP is essential for capacity and health monitoring. NetFlow is essential for traffic analysis and top-talker investigations. Most mature monitoring deployments use both in parallel.
How do you choose the right network monitoring tool?
Start with your environment. Count the sites, count the devices, and estimate growth over 24 months. Then decide whether your team is cloud-first or on-prem-first. Next, list the protocols you need: SNMP is always on the list; decide whether flow analysis, WMI, and scripts are needed on day one or later. Finally, compare pricing models across per-device, per-sensor, per-element, and quote-based options. For MSPs and multi-site IT teams, per-device pricing tends to scale most predictably.
Are agentless protocols better than agent-based monitoring?
Agentless protocols like SNMP and ICMP are generally preferred for network devices because they avoid the operational overhead of installing and maintaining software on every switch, router, and firewall. Agent-based approaches make more sense for servers and workstations, where agents can surface OS-level metrics that protocols cannot reach. The strongest monitoring platforms combine both: agentless discovery for the network layer and agents or API integrations for deep server visibility.
Is SNMP v3 secure enough for production networks?
Yes. SNMP v3 supports authentication (authNoPriv) and encryption (authPriv) using standard algorithms including SHA-256 and AES-256. When configured correctly, SNMP v3 is acceptable for production monitoring across most security frameworks. The important caveat is configuration quality: default community strings, weak passphrases, and reused credentials undermine the protocol regardless of version. SNMP v1 and v2c should be restricted to isolated management VLANs or replaced with v3 wherever possible.