The Domotz team is always up to something new, but January 2024 was really special. We deliver a new release packed with features and improvements. We’re also pleased to share some cool educational content and a live event in the works.
This Domotz release makes the platform more accessible and useful to all.
Embrace the new year: Elevate your network monitoring in 2024.
Domotz’s January newsletter will be about the following: New features, improvements, additional scripts, and SNMP templates. Plus, we will cover our “Meet the Experts” webinar and ISE Barcelona.
Read what’s new at Domotz this month!
Our Product News
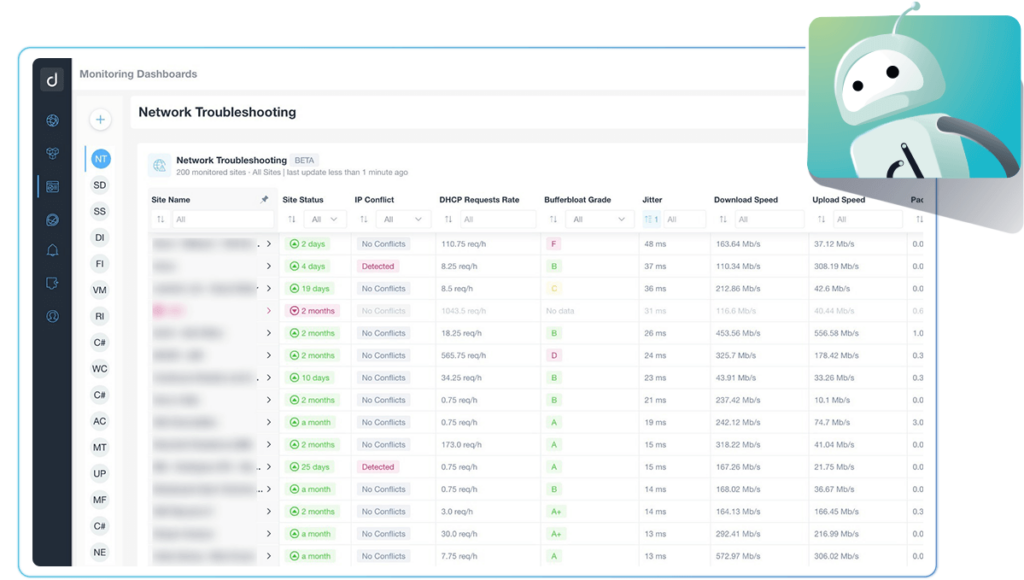
Effortless troubleshooting with our latest IP conflict alert feature
Our recently launched Network Troubleshooting feature becomes even more powerful with the addition of automatic notifications whenever an IP conflict is detected. Choose your preferred contact channel to get real-time alerts across all your sites!
New automation and scripts
By leveraging our integration scripts and SNMP templates, you can manage and monitor a wide variety of metrics for network devices, cloud services, and web applications.
With our Automation and scripts, you can proactively identify and address anomalies in any system. Here’s what’s new in this Domotz newsletter:
Integration Scripts
Linux

Proactive monitor Linux host with our ready-to-use custom scripts:
- Linux CPU Usage
- Linux CPU Utilization per Process
- Linux Hard Disk Partitions
OPNsense

We create the following scripts to enable the monitoring of an OPNsense host:
- General Monitoring
- Services
- Nat Rules
- Filter Rules
- Interface Stats (IPV4 and IPV6)
- Gateway Stats
Pre-configured SNMP templates
Fortinet

In the case of a Fortinet FortiGate firewall, a pre-configured SNMP template is available to extract the following general properties:
- Serial Number
- Firmware Version
- Number of Admin users
- CPU usage
- Memory usage
Ruckus

Monitor specific items for your Ruckus switches using the following pre-configured SNMP templates:
- Serial Number
- CPU and Memory Usage
- Power Supply Units
- Fans
Juniper

With this SNMP template, you will be able to monitor the following:
- Component Name
- CPU Usage
- Temperature
Improvements
Serial numbers are now available also in the monitoring dashboards
Track and manage devices more effectively by utilizing the serial number as a key piece of device information in the dashboard tables.
Get a bird’s-eye view of your network’s health
Our easy-to-read Network Troubleshooting table allows you to quickly assess and compare the performance of different network segments at a glance.
