IT infrastructure is harder to monitor in 2026 than it has ever been. A typical environment now spans on-premises network gear, cloud workloads, virtual servers, containers, SaaS applications, and remote sites. One platform is rarely enough to cover all of it, but the right tool for your core infrastructure makes everything else easier. This guide reviews the 10 best IT infrastructure monitoring tools available today, with a specific focus on what MSPs and IT teams actually need: real-time visibility, clean deployment, predictable pricing, and enough depth to catch issues before users call.
The tools here fall into three broad camps. Network-focused platforms like Domotz, PRTG, and Nagios excel at device-level monitoring across switches, firewalls, servers, and endpoints. Full-stack observability platforms like Datadog and Dynatrace add application, log, and user experience monitoring on top of the infrastructure layer. Open-source options like Zabbix and Icinga trade upfront license cost for technical investment. All 10 are credible choices; the right one depends on your team size, environment, and budget model.
By the end, you will have a clear view of where each tool fits and how to pick the one that matches your environment.
Table of contents
- What is IT infrastructure monitoring?
- How we evaluated these IT infrastructure monitoring tools
- IT infrastructure monitoring tools at a glance
- 1. Domotz
- 2. SolarWinds Observability SaaS
- 3. Datadog
- 4. Paessler PRTG Network Monitor
- 5. Zabbix
- 6. Dynatrace
- 7. ManageEngine Site24x7
- 8. LogicMonitor
- 9. Icinga
- 10. Nagios XI
- How to choose the right IT infrastructure monitoring tool
- Conclusion
- Frequently asked questions
What is IT infrastructure monitoring?
IT infrastructure monitoring is the continuous observation of the hardware, software, and network components that keep business services running. It covers servers, virtual machines, containers, switches, routers, firewalls, wireless access points, storage, databases, cloud workloads, and sometimes applications and end-user experience. The goal is to detect performance degradation, availability issues, and configuration drift in real time, and to surface the data engineers need to fix problems fast.
Modern infrastructure monitoring tools fall into two architectural camps. Agentless platforms collect data using protocols like SNMP, ICMP, WMI, and API calls, typically through a lightweight collector deployed in the environment. Agent-based platforms install software on each monitored host, which enables deeper visibility into applications and process-level metrics but adds deployment overhead. Each approach has a place; the right one depends on what you need to see and how much operational effort you can absorb.
How we evaluated these IT infrastructure monitoring tools
Every tool in this guide was evaluated against four criteria drawn from real MSP and IT team requirements.
Comprehensive monitoring capabilities. The tool must cover the core infrastructure categories most teams need: network devices, servers, virtual machines, and cloud workloads. Depth matters in the monitoring areas the tool focuses on.
Deployment model and operational effort. Agentless platforms deploy faster and scale better for multi-site MSP environments. Agent-based platforms offer deeper application visibility but require per-host installation and maintenance. Both are valid; fit to your environment is what matters.
Scalability across sites and workloads. MSPs and distributed IT teams need tools that handle many customer environments or many business locations without architectural changes. Cloud-hosted consoles with lightweight collectors tend to win here.
Cost-effectiveness and pricing clarity. Transparent, predictable pricing is weighted heavily. Per-device and flat-rate models tend to scale predictably. Per-GB, per-sensor, and quote-based models can create budget surprises at scale.
IT infrastructure monitoring tools at a glance
| Tool | Best for | Architecture | Starting price | Deployment |
| Domotz | MSPs and multi-site IT teams | Agentless with on-prem collector | $1.50 per managed device per month | Cloud with on-prem collector |
| SolarWinds Observability SaaS | Hybrid IT teams with AIOps needs | Agent-based | From approximately $6 per node per month (annual) | SaaS |
| Datadog | Cloud-native and DevOps teams | Agent-based | From $15 per host per month | SaaS |
| Paessler PRTG Network Monitor | Windows-heavy small to mid-size IT | Sensor-based, agent optional | Free up to 100 sensors, paid from approximately $2,149 | On-prem or hosted |
| Zabbix | Technical teams wanting full control | Agent or agentless | Free, open-source | On-prem or Zabbix Cloud |
| Dynatrace | Large enterprises needing AI-driven APM | Agent-based (OneAgent) | From approximately $21 per 8 GB host per month | SaaS or Managed |
| ManageEngine Site24x7 | SMBs and mid-market IT teams | Agent-based | From approximately $9 per month | SaaS |
| LogicMonitor | Mid-to-large enterprises, hybrid cloud | Agentless Collectors | Custom, reported $16 to $53 per unit per month | SaaS |
| Icinga | Linux shops and plugin-driven teams | Agent or agentless | Free, open-source | On-prem |
| Nagios XI | Plugin-driven shops with Linux expertise | Agent or agentless | From approximately $2,495 per 100 nodes | On-prem |
Pricing is based on publicly available and community-sourced information and may not reflect current or exact vendor pricing. Always check with the vendor for the latest details.
1. Domotz
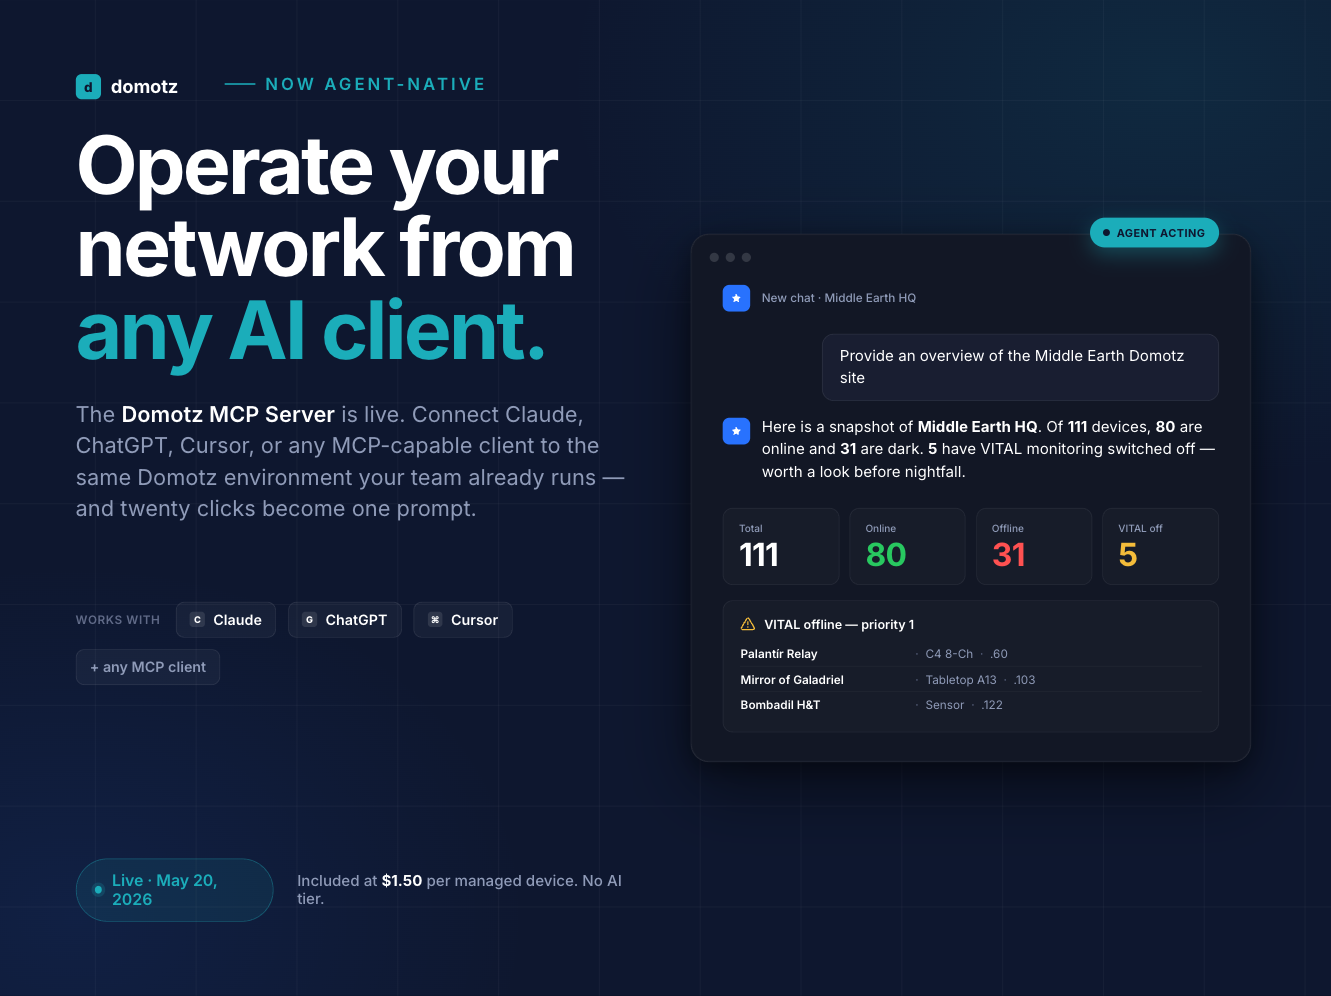
Domotz is a cloud-based network and IT infrastructure monitoring platform built for MSPs, internal IT teams, and technical service providers. It combines agentless device discovery, SNMP monitoring across versions 1, 2c, and 3, ICMP-based network diagnostics, TCP port monitoring, custom scripts, and secure remote access in a single per-device subscription. Domotz deploys in under 15 minutes using a lightweight collector on existing hardware, a virtual machine, a NAS appliance, or the Domotz Box.
The platform is purpose-built for multi-site monitoring, which makes it a natural fit for MSPs managing dozens or hundreds of customer networks. Automatic discovery identifies every device on the network and applies pre-configured SNMP templates where available. Engineers can extend coverage with the built-in MIB browser and custom SNMP or TCP sensors. For teams also tracking security posture, Domotz provides continuous device inventory, TCP port scans, and new-device alerts that feed into any broader network security process.
- Best for: MSPs, internal IT teams, and AV integrators monitoring multiple sites or customers, where agentless deployment and transparent per-device pricing matter more than application-layer depth.
- Pricing: $1.50 per managed device per month, billed in bundles of 10 devices ($15 per month minimum). 14-day free trial, no credit card required. Unmanaged devices are discovered at no cost. See Domotz pricing for full details.
- Deployment: Cloud-hosted console with lightweight on-premises collector. Over 25 deployment options including Windows, Linux, NAS, virtual machines, and the Domotz Box.
- Strengths: Agentless architecture, fast deployment, strong SNMP coverage with pre-configured templates, secure remote access without VPN, PSA and RMM integrations, transparent per-device pricing, SOC 2 Type II and ISO 27001 certified.
2. SolarWinds Observability SaaS
SolarWinds Observability SaaS is the company’s cloud-native, full-stack observability platform covering infrastructure, applications, logs, databases, networks, and user experience. It serves as a modern replacement for teams that have outgrown the traditional on-premises SolarWinds suite but want to stay in the SolarWinds ecosystem. The platform uses AIOps to detect anomalies and correlate events across layers.
The tradeoff is architectural. Observability SaaS is agent-based and requires OneAgent-style installation on monitored hosts. For network device monitoring at scale, the classic SolarWinds NPM remains the stronger product. Observability SaaS is best when you need unified visibility across apps and infrastructure in one SaaS console.
- Best for: Hybrid IT teams managing multi-cloud environments who want AIOps-driven observability across apps and infrastructure.
- Pricing: From approximately $6 per node per month (annual term). Community-reported.
- Deployment: SaaS.
- Strengths: AIOps anomaly detection, unified observability across apps and infrastructure, strong log analytics, mature SolarWinds ecosystem integration.
3. Datadog
Datadog is one of the most broadly deployed full-stack observability platforms. The platform covers infrastructure monitoring, application performance monitoring (APM), log management, real user monitoring, synthetic testing, and security monitoring through a large catalog of integrations. Datadog’s strength is breadth: over 650 integrations and a consistent query and visualization experience across data types.
Datadog is agent-based. The Datadog Agent installs on each host and forwards metrics, logs, and traces to the SaaS console. For cloud-native and DevOps teams, this is a feature. For network-device-heavy MSP environments, the agent-per-host model can be operationally heavy and expensive. Predictable monthly costs require careful management of log ingest and custom metric volumes.
- Best for: Cloud-native and DevOps teams that need metrics, logs, and traces correlated in a single SaaS platform.
- Pricing: Infrastructure Pro from $15 per host per month. APM, logs, and other modules priced separately. Community-reported.
- Deployment: SaaS with per-host Agent installation.
- Strengths: Broad integration catalog, strong APM and log analytics, fast time-to-value for cloud workloads, mature dashboard and alerting layer.
4. Paessler PRTG Network Monitor
PRTG from Paessler uses a sensor-based monitoring model where each individual metric on a device is a sensor. A single switch might use 10 to 50 sensors depending on what you monitor. PRTG supports SNMP, WMI, NetFlow, sFlow, ICMP, syslog, and custom scripts through a large library of pre-built sensor types. The platform is known for a clean GUI and fast setup.
The free tier covering 100 sensors is genuinely useful for small environments. At scale, sensor counts add up quickly, and PRTG pricing can become difficult to predict. PRTG is most commonly deployed by Windows-heavy small and mid-size IT teams that want a single product for network and server monitoring without the operational overhead of open-source alternatives.
- Best for: Windows-heavy small and mid-size IT teams that want fast setup and a clean management interface.
- Pricing: Free up to 100 sensors. Paid tiers from approximately $2,149 for 500 sensors. Community-reported.
- Deployment: On-prem or PRTG Hosted Monitor (cloud).
- Strengths: Useful free tier, broad protocol coverage, strong sensor library, clean interface, reliable Windows support.
5. Zabbix
Zabbix is a fully open-source monitoring platform with native support for SNMP, ICMP, IPMI, JMX, and its own lightweight agent. It covers network, server, application, and cloud monitoring in a single product with no licensing fees. The Zabbix community maintains templates for thousands of device types, and Zabbix SIA offers paid support subscriptions for teams that want a safety net.
Zabbix is powerful but has a steep learning curve. Initial setup, template tuning, and database performance management all take real investment. The UI is functional rather than elegant. For teams willing to invest the time, Zabbix delivers enterprise-grade monitoring at zero license cost.
- Best for: Technical teams with Linux expertise who want full control and no license fees.
- Pricing: Free, open-source. Paid support subscriptions and Zabbix Cloud available.
- Deployment: On-premises or Zabbix Cloud.
- Strengths: Zero license cost, strong template ecosystem, flexible architecture, active development, scales to very large environments.
6. Dynatrace
Dynatrace is a full-stack observability platform with AI-driven analysis at its core. The Davis AI engine maps service dependencies automatically and identifies root causes without manual configuration. OneAgent, the platform’s single installer, covers infrastructure, application, database, and real user monitoring from one agent per host. For large enterprises with complex, dynamic environments, Dynatrace’s automated analysis is a meaningful differentiator.
Dynatrace is enterprise-priced. The platform delivers deep value in environments with 100+ hosts and mature observability practices, but smaller teams often find the cost and learning curve hard to justify. Teams choosing between Dynatrace and Datadog generally sort on depth versus breadth: Dynatrace goes deeper with AI, Datadog goes broader with integrations.
- Best for: Large enterprises with 100+ hosts and complex, dynamic environments where AI-driven root-cause analysis delivers measurable value.
- Pricing: Infrastructure monitoring from approximately $21 per 8 GB host per month. Full-stack monitoring from approximately $29 per host per month. Community-reported.
- Deployment: Dynatrace SaaS or Dynatrace Managed (on-prem SaaS).
- Strengths: Davis AI root-cause analysis, single OneAgent covers the full stack, automatic dependency mapping, strong APM and digital experience monitoring.
7. ManageEngine Site24x7
Site24x7 is ManageEngine’s all-in-one, cloud-based monitoring platform covering websites, servers, networks, applications, and public cloud workloads. The platform targets SMBs and mid-market IT teams with entry pricing that sits well below enterprise alternatives. Site24x7 is agent-based for server monitoring and uses external probes for website and synthetic monitoring.
For teams already using other ManageEngine products (OpManager, ServiceDesk Plus), Site24x7 integrates natively, which simplifies troubleshooting across monitoring and ITSM. The breadth of what Site24x7 covers at its price point is genuinely competitive; the tradeoff is that depth in any one area is lower than specialist tools.
- Best for: SMBs and mid-market IT teams looking for broad monitoring coverage at a low entry price.
- Pricing: From approximately $9 per month for Pro plan. Community-reported.
- Deployment: SaaS.
- Strengths: Low entry price, broad coverage across websites, servers, networks, apps, and cloud, strong integration with other ManageEngine products, simple setup.
8. LogicMonitor
LogicMonitor is a SaaS observability platform that covers network, server, cloud, and application monitoring in one product. It uses on-premises Collectors (similar architecturally to Domotz) to monitor local infrastructure without installing agents on every device. LogicMonitor supports SNMP, NetFlow, WMI, syslog, and API-based data collection through a large DataSource library.
The platform leans on AIOps features for anomaly detection and forecasting, which appeal to larger operations teams. LogicMonitor’s pricing is custom and based on Hybrid Units, which makes direct comparison difficult. For teams evaluating both, see Domotz versus LogicMonitor.
- Best for: Mid-to-large enterprises with hybrid on-premises and cloud infrastructure that want unified observability.
- Pricing: Custom. Community-reported approximately $16 to $53 per Hybrid Unit per month.
- Deployment: SaaS with on-prem Collectors.
- Strengths: Agentless Collector architecture, large DataSource library, AIOps features, strong cloud and hybrid support.
9. Icinga
Icinga started as a Nagios fork in 2009 and has evolved into a more modern, active open-source monitoring platform. It keeps Nagios plugin compatibility (which unlocks thousands of existing checks) while offering a cleaner web interface, a REST API, and native integrations with modern tools. Icinga supports agent-based and agentless monitoring, SNMP, WMI, and custom scripts.
Icinga rewards Linux-comfortable teams. It is more approachable than vanilla Nagios but still requires real technical investment to operate at scale. For teams that already use Nagios plugins and want a more modern platform without abandoning their existing checks, Icinga is the natural upgrade path.
- Best for: Linux shops with existing Nagios plugin investments looking for a more modern open-source platform.
- Pricing: Free, open-source. Paid enterprise support available through Icinga GmbH.
- Deployment: On-premises.
- Strengths: Nagios plugin compatibility, modern web interface, REST API, active development, flexible deployment architecture.
10. Nagios XI
Nagios XI is the commercial version of the long-standing Nagios open-source monitoring platform. It provides the classic plugin-based Nagios engine wrapped in a polished GUI, supported installation, configuration wizards, and enterprise features. For teams that want the depth and flexibility of Nagios without managing the open-source distribution themselves, Nagios XI is the commercial path.
The plugin ecosystem is Nagios’s biggest strength. Thousands of community and commercial plugins cover almost any device or metric imaginable. Nagios XI is most commonly deployed by technical teams with Linux expertise who value unlimited customization over out-of-the-box polish.
- Best for: Technical teams with Linux expertise and custom monitoring requirements that need commercial support.
- Pricing: Nagios XI Standard from approximately $2,495 per 100 nodes. Nagios Core is free. Community-reported.
- Deployment: On-premises.
- Strengths: Massive plugin library, highly customizable, commercial support, mature and stable codebase.
How to choose the right IT infrastructure monitoring tool
The right tool depends on three things: what you actually need to monitor, how much operational effort you can absorb, and how your pricing tolerance matches the vendor’s model. Three short questions usually narrow the choice fast.
1. Is your environment network-heavy or application-heavy? If most of what you monitor is switches, routers, firewalls, servers, and connected devices, agentless network-focused platforms like Domotz, PRTG, or LogicMonitor are the best fit. If your primary concern is application performance and cloud workloads, full-stack observability platforms like Datadog and Dynatrace go deeper where it matters.
2. Are you managing one environment or many? MSPs and distributed IT teams managing multiple sites or customer networks benefit from cloud-hosted consoles with lightweight on-premises collectors. Single-location enterprises can consider on-premises options like Zabbix, Icinga, or Nagios XI where architectural control matters more than multi-tenant scale.
3. Do you have the team to run an open-source platform? Zabbix, Icinga, and Nagios Core have zero license cost but require real technical investment. Teams without dedicated Linux expertise typically find that commercial platforms cost less in total when the operational effort is accounted for.
For a deeper look at protocol-specific tool capabilities, see the top 10 network management software for 2026 and the top 12 SNMP monitoring tools for IT teams in 2026.
Conclusion
IT infrastructure monitoring is no longer one-size-fits-all. Network-focused teams, MSPs, cloud-native DevOps teams, and enterprise operations teams all need different tools. The 10 platforms in this guide each own a specific use case, and the right one for your environment depends on the mix of network devices, servers, cloud workloads, and applications you actually have to watch.
Domotz is built for teams that need strong network and device monitoring across multiple sites without the operational overhead of agent-per-host deployments. Agentless discovery, SNMP v1/v2c/v3 with pre-configured templates, secure remote access, and transparent pricing at $1.50 per managed device per month make it a natural fit for MSPs and distributed IT teams. Deployment takes under 15 minutes on existing hardware, and the 14-day trial requires no credit card.
Start your free 14-day Domotz trial and see how agentless infrastructure monitoring works on your own network.
Frequently asked questions
What are the best tools for real-time IT infrastructure monitoring?
The best tools for real-time IT infrastructure monitoring depend on what you are monitoring. For network-device-heavy environments, Domotz, PRTG, and LogicMonitor all provide real-time visibility through SNMP, ICMP, and flow protocols. For cloud and application-heavy environments, Datadog and Dynatrace deliver real-time metrics, logs, and traces through agent-based collection. For open-source options, Zabbix provides sub-minute polling at zero license cost. All of these tools surface issues within minutes of occurrence; the differences are in depth, deployment model, and price.
How do infrastructure monitoring tools reduce MTTR?
Infrastructure monitoring tools reduce mean time to resolution (MTTR) in three ways. First, real-time alerting surfaces issues before users report them, which cuts the time between problem and detection. Second, automatic device discovery and topology mapping show engineers exactly which devices and services are affected, which shortens triage. Third, integrated remote access and configuration management let engineers fix many issues without traveling to the site, which eliminates truck rolls. For MSPs, the combination can reduce MTTR by 50% or more compared to reactive, ticket-driven support.
What is the difference between agent-based and agentless monitoring?
Agent-based monitoring installs software on each monitored device. The agent collects metrics, logs, and traces locally and forwards them to a central console. This approach gives deep visibility into operating systems and applications but requires installing, maintaining, and securing the agent on every host. Agentless monitoring uses standard protocols like SNMP, ICMP, WMI, and APIs to collect data remotely through a lightweight collector or probe. This approach deploys faster and scales better across many sites, though it does not reach the same application-layer depth as agents. Most strong monitoring strategies combine both: agentless for network devices, agent-based for critical servers and applications.
How do I choose the right infrastructure monitoring tool for my business?
Start with your environment. Count the network devices, servers, and cloud workloads you need to monitor. Identify your top three monitoring priorities (availability, performance, security, compliance, capacity planning). Decide whether you have Linux expertise to operate an open-source platform or whether a commercial product will cost less in total. Next, test pricing models against your growth plan for 24 months. Per-device and flat-rate pricing usually scale most predictably for MSPs and multi-site teams. Per-host, per-sensor, and per-GB models can create budget pressure at scale. Finally, run a trial on a representative subset of your environment before committing.
What are the benefits of using cloud infrastructure monitoring tools?
Cloud-based infrastructure monitoring platforms offer four main benefits over traditional on-premises tools. First, deployment is fast: a cloud console with a lightweight collector can start monitoring within 15 minutes, compared to days or weeks for self-hosted alternatives. Second, updates happen automatically: the vendor maintains the platform, which eliminates the operational cost of patching and upgrading the monitoring system itself. Third, multi-site support is native: a single console can monitor unlimited locations without architectural changes. Fourth, redundancy and availability are handled by the vendor, which means the monitoring platform stays up even when your own infrastructure is under stress.
How do infrastructure monitoring tools support MSPs?
MSPs have specific needs that general-purpose monitoring tools do not always serve well. Multi-tenant architecture is the biggest one: an MSP needs to manage dozens or hundreds of customer environments from a single console without data leaking between tenants. Per-customer billing and reporting matter for service delivery and margin management. Remote access without VPN reduces truck rolls, which directly improves margin per site. Integrations with PSA platforms like ConnectWise, Autotask, HaloPSA, and Syncro turn alerts into tickets automatically, which tightens response workflow. Platforms like Domotz were built specifically around these MSP requirements, which is why they typically fit distributed service businesses better than tools designed for single-enterprise IT teams.
Is cloud or on-premises infrastructure monitoring better?
Cloud-based monitoring is better for most teams in 2026. It deploys faster, updates automatically, scales across unlimited sites, and has lower total operational cost than self-hosted alternatives. On-premises monitoring still makes sense in three cases. First, regulated environments with strict data residency requirements may need the monitoring data to stay in-country. Second, air-gapped or highly segmented networks cannot always reach a cloud console. Third, very large single-site enterprises with strong Linux teams sometimes prefer on-premises for architectural control. Outside of these cases, cloud-hosted monitoring with a lightweight on-premises collector is the dominant architecture.
What does an infrastructure monitoring tool typically monitor?
A typical infrastructure monitoring tool covers five main layers. Network devices (switches, routers, firewalls, wireless access points) are monitored via SNMP, ICMP, and flow protocols. Servers and virtual machines are monitored via SNMP, WMI, or an installed agent for OS-level metrics. Storage systems (NAS, SAN) are monitored via SNMP and vendor APIs. Cloud workloads are monitored via provider APIs for services like AWS, Azure, and GCP. Applications and services are monitored via TCP port checks, HTTP probes, and APM agents where deeper visibility is needed. The strongest platforms combine all five into a single console.