Happy New Year! In the run-up to 2023, we’ve been swamped with improving our network monitoring software. Thank you to everyone who has given us valuable feedback, we also rely on your suggestions to make Domotz the best it can be.
From cybersecurity white paper to powerful custom integrations, here’s everything we’ve been working on from October to December 2022.
We can break our Domotz Q4 news down into two sections:
1. New Features and Resources
Cybersecurity Awareness Month Roundup
October has come and gone, but the value of knowing how to manage cybersecurity remains all year round!
Previously, we wrote about how to use Domotz to help manage CIS security controls, including:
- Discovering all MAC addresses on your networks
- Identifying unauthorized devices by make, model, and type
- Secure network configuration
- Automatically scanning for network vulnerabilities
Besides, our network monitoring software enables your organization to meet certain safeguards associated with various CIS controls. Read more and download our dedicated White Paper on CIS security controls.
Integrated Sony AV Equipment
You can now use Domotz to integrate with Sony AV. Leverage this integration to monitor TVs, displays, sound bars, projectors, and audio-visual receivers. With Domotz, you can:
- Firstly, recognize devices automatically to confirm what’s connected to your system
- Secondly, troubleshoot issues, power cycle, or reboot systems remotely
- Last but not least, remotely control Sony displays, including volume control and status
Basically, if you’re a professional integrator, our additional Sony integration features are designed specifically for you.
New Pre-configured SNMP sensors templates
November saw the launch of two new sets of Pre-configured SNMP sensors for Synology NAS drives:
- RAID Volumes: for each RAID configured on the Synology NAS, we monitor status, usage, and available free storage. For each sensor retrieved, you also get a graphical representation of the historical values.
- Disks SMART information: for each disk and variable, we monitor the status and the value (for instance, Airflow Temperature, Command Timeout, Pending Sector, E2E Errors, Power Cycle Counts, etc.).
Our templates are configured right out of the box without needing to set them up for every device you add manually.
Group Network Interface Cards into a single device
Finally, you can group/ungroup network interface cards that were separate entities into a single line item. Firstly, this function allows you to monitor your network interfaces as a single device and get alerts when they are down.
For instance, networks with VLANs on a switch port will display the switch just once, instead of multiple times, for more accurate network topology. Moreover, you can merge PCs with ethernet and WiFi (previously displayed as two entities) into just one.
Kubernetes Integration
We’ve added Kubernetes integration to our growing list of Application and Cloud Monitoring features. Proactively monitor your Kubernetes Cluster status, Nodes/Pods, and other API metrics.
To enable the Kubernetes monitoring driver, you can find the monitoring cluster driver codes in our examples library. Just customize the Kubernetes monitoring drivers to fit your needs!
Powerful Custom Integrations
Our new powerful Custom Integrations now enable you to do much more, for instance:
- Apply more than one integration script to a single device
- View the historical data each driver extracts
- Export all the information in CSV format.
That’s not all you can do. Additionally, you can check whether your drivers are actively monitoring as they should be. You’ll automatically receive an email notification if your drivers are not working.
Docker Container Monitoring
We also now have Docker container monitoring so you can view and inspect docker server info. Monitor docker container information such as:
- Performance of every container on your docker-engine
- Troubleshoot performance issues
- Hardware resource consumption
We’ve got three new drivers for you, depending on the information you want to monitor.
Website Content Monitoring
To conclude, now you can manage the generic content on any HTTP/HTTPS-based pages you manage. With our new website content monitoring feature, you can:
- Inspect content in PHP, HTML, JSON and other formats
- Verify returned code from HTTP-based calls
- Measure HTTP-based call response times
Use this custom integration to monitor single or multiple web pages and proactively monitor your Docker engines and instances.
2. Updates and Improvements
Performance increase in Sites Explorer for scalability
In this case, our backend has seen improvements for the Sites Explorer, translating into better performance when managing many sites. For example, one of our customers managing 3000 sites now sees a 75% performance improvement.
Monitoring Dashboard Column Editing
The correct information where you need it! You could always manage columns for your device tables, and we’ve now extended this to sensors tables such as pre-configured SNMP sensors. Now you can create a monitoring table for your SNMP sensors and select the columns you want to see.
App & Cloud Monitoring Integrations
This quarter also saw new custom integrations for monitoring PFSENSE & FreeBSD, NGNIX, Apache, and Redis. These new integrations join our growing list of Cloud & App Monitoring integrations.
Custom Monitoring Dashboard Enhancements
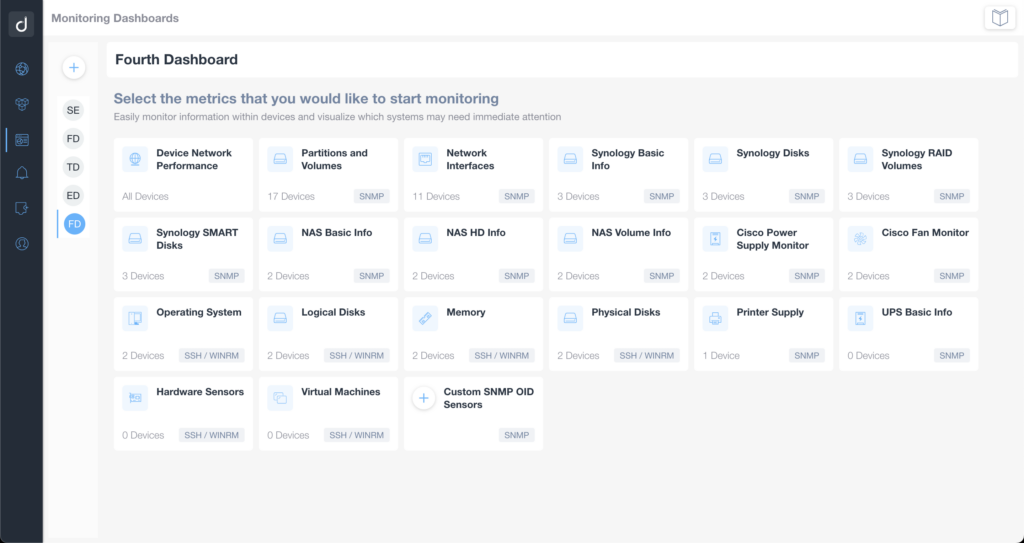
Thank to one of the latest releases, it’s now super easy to create a monitoring dashboard with the metrics, properties, and devices you care about most. Choose your metrics (like Network Interfaces, Disks, OS, etc.), your properties (Operational Status, Inbound traffic, etc.), and the devices you want to see in the table. There’s also more flexibility. For instance, customize your tables, pin or remove columns, and more.
To resume, all these enhancements translate into a more intuitive and easy-to-set-up monitoring experience.
Domotz News in Summary
In conclusion, here’s what we’ve been working on in the last quarter of 2022:
- An insightful White Paper for Cybersecurity Awareness Month
- Sony AV system integration to monitor displays, sound bars, projectors, and AV receivers
- New pre-configured SNMP sensors templates
- Docker container monitoring
- Generic website content monitoring on HTTP and HTTPS-based pages
- New App & Cloud Monitoring Integrations
- Custom Monitoring Dashboard enhancements
Here’s to 2023, thank you again for your feedback and suggestions! All of your feedback helps us improve to close the gaps with competitors and deliver you the most powerful network monitoring software we can.
Still looking for more updates, resources, and news? Check out our blog and sign up for our newsletter!
