Your own Network Monitoring Dashboards for Network and Device Intelligence
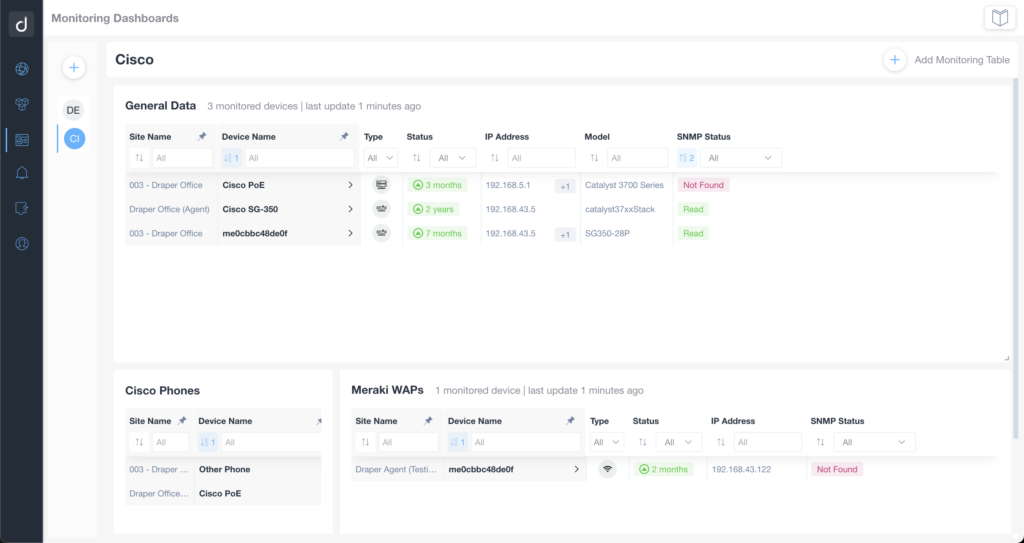
Domotz network monitoring software now includes the ability to create your own monitoring dashboards with the devices, sensors and information you care about. In short, our network monitoring dashboard feature enables you to get the information you want, where you want it to work with more intelligence when managing networks.
In this article, we’ll explain our Network Monitoring Dashboard feature, how they work and most importantly the KPIs you can monitor with them. We’ll also cover what’s coming next to this feature.
Flexible network monitoring dashboards enable you to be proactive
Our network monitoring dashboard enables you to create your own tables for monitoring. Moreover, they enable you to monitor multiple devices from across different sites from a single viewpoint. This is particularly useful if you need to manage networks for multiple customers.
In short, you can use our network monitoring dashboard to monitor multiple customers simultaneously. Additionally, you can monitor a lot of devices, across your sites from one place. Moreover, you can monitor devices with the same type (printers, NAS, UPS etc.) and different types too, across multiple agents.
Creating your first monitoring tables leveraging our network monitoring dashboard is super easy. Just follow a few simple steps.
When creating our network monitoring dashboard feature we also thought about your need for flexibility. Because of this, you can create more than one network monitoring dashboard to monitor different KPIs and situations. Every dashboard can contain more tables so you can really personalize your monitoring experience.
For example, you could create a dashboard for each type of device. Additionally, you could create a table for monitoring SNMP sensors or an additional table with OS sensors.
A typical example that immediately shows the power of this tool is monitoring printer ink levels. You can get a single table for all your client sites that monitors printer ink levels at various locations. This means you can quickly identify which clients have printer ink levels that need replenishing. Essentially before your customer notices when trying to print something that there is no ink left, you can already have a new one ready to install.
What can you monitor with Domotz monitoring dashboards?
You can create tables based on your needs.
Here is what you can monitor with our network monitoring dashboard.
- DEVICE: Generate tables for devices and monitor information such as status, important data, network info (defined by Domotz), ping, Pre-configured SNMP sensors active, and check the connection to the correct OID port.
- SENSORS: You can create tables summarizing information and data extracted directly from a certain type of device or specific devices. For example, you can create a table with sensors from network interfaces.
By choosing a device that supports our pre-configured SNMP sensors you can get information about every single port of a switch. You can get detailed information such as status, outgoing and incoming traffic, lost packets and any errors so that you can carry out a thorough analysis of your network and identify any malfunctions. The Sensors table also allows you to monitor OS Monitoring sensors that include information about the status of hard drives and memory. Additionally, you can monitor specific sensors such as the temperature or fan status of a device.
Monitoring dashboard latest updates
We wanted you to have the most flexibility in creating your network monitoring dashboards. This is why we’ve worked hard to add and tweak the following features so you can really customize your experience.
- View details: By selecting a device and clicking “View Details” over the device name, a side panel will open with all the essential details. Thanks to this shortcut to access your device details, you can quickly get “extended” information directly from the table.
- Resize & move: You can resize and move tables around to create a custom view. You can move around how you display information, and also the information inside the tables. Additionally, you can also move tables around in your work area.
- Pop your tables out: You can now open in a new window, one monitoring table at a time. This means you do not have to keep the entire Domotz webapp open in the background. You can isolate a single table in an external window continuing the monitoring action at the same time as other activities.
Network monitoring dashboards evolution
We continue to improve our network monitoring dashboard features. So much has been done in terms of improving the user experience but so much will be done in the coming months to follow.
We’ll continue improving the interface to make it better in terms of flexibility and usability.
We’ve made it even easier to make a network monitoring dashboard too. All you need to do is follow 3 simple steps to create a dashboard. That’s pretty intuitive if you ask me.
To stay up to date on how our network monitoring dashboard evolves, follow us on social media (Facebook, Twitter, Instagram, LinkedIn, YouTube), subscribe to our Newsletter, or contact our support team.
Want to learn more about Domotz features? Read our article about Custom Integration and Pre-configured SNMP sensors.