In today’s rapidly evolving technology landscape, Managed Service Providers (MSPs) play a crucial role in ensuring the smooth operation of any IT infrastructure. With an increasing number of devices, applications, and network security issues to manage, the ability to monitor everything efficiently and swiftly is paramount.
As an MSP, you must have a comprehensive monitoring solution to deliver top-notch services. Most of all, you must rely on real-time insights to help you detect issues before they escalate and provide rapid response capabilities.
In this blog post, we’ll illustrate what a monitoring dashboard is and how to use it to boost your monitoring. We’ll include the following:
- What is a network monitoring dashboard?
- Why are network monitoring dashboards so important?
- What is a Domotz network monitoring dashboard?
- Domotz monitoring dashboards from static to dynamic
- The top 5 network monitoring dashboards most frequently created by MSPs
- Conclusions
What is a network monitoring dashboard?
A network monitoring dashboard is a graphical user interface (GUI) or a visual representation of key network metrics and data. It provides a consolidated view of a computer network’s status, performance, and health in a user-friendly and easily digestible format.
The dashboard typically displays various metrics and information about your network, such as device status, performance metrics, security alerts, and system health.
Why are network monitoring dashboards so important?
Network monitoring dashboards are essential tools for several reasons:
- Real-time Visibility: Network monitoring dashboards provide real-time visibility into the status and performance of your network infrastructure. In other words, they offer a quick view of the health of your network, including device status, connectivity, bandwidth usage, and other critical metrics.
- Proactive Issue Detection: Dashboards enable proactive monitoring by alerting you to potential issues or abnormalities before they escalate into major problems. By monitoring key performance indicators and receiving alerts or notifications, you can identify and resolve issues promptly, minimizing downtime and optimizing network performance.
- Troubleshooting and Diagnostics: When network issues arise, your dashboards provide valuable insights to diagnose and troubleshoot problems effectively. You can quickly check details about devices, connections, traffic patterns, and performance metrics. Thus, you’ll be able to pinpoint the root cause of issues and take appropriate corrective actions.
- Capacity Planning: Network monitoring dashboards help with capacity planning by providing data on network utilization trends, bandwidth consumption, and resource usage patterns. This information allows you to anticipate future network demands, plan for growth, and allocate resources efficiently.
- Security Monitoring: Dashboards are crucial to network security by monitoring potential security breaches, unauthorized access, or suspicious activities. They can display security-related events, track firewall logs, monitor network traffic, and detect anomalies that may indicate a security threat.
- Performance Optimization: By monitoring network performance metrics through dashboards, you can identify bottlenecks, optimize resource allocation, and improve overall network performance. Dashboards enable you to track latency, packet loss, bandwidth utilization, and other performance indicators, allowing you to fine-tune your network configuration and ensure optimal performance.
In summary, network monitoring dashboards provide real-time visibility, capacity planning insights, and proactive issue detection. In addition, they offer troubleshooting capabilities, security monitoring, and performance optimization. They are crucial for maintaining a stable, secure, high-performing network infrastructure.
What is a Domotz network monitoring dashboard?
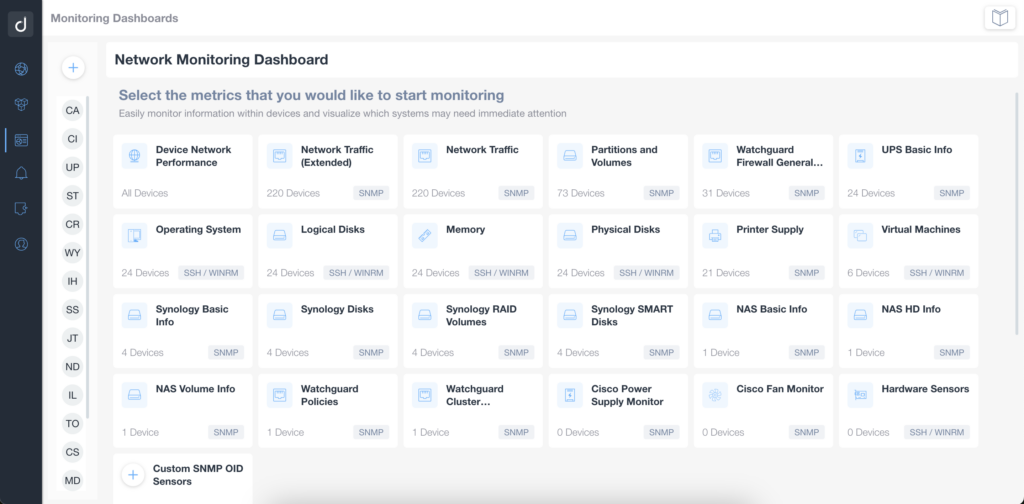
A Domotz network monitoring dashboard allows you to monitor what you want in the way you want. In other words, you can decide what to monitor and put it in the format you want to quickly sort, filter and react to when an issue occurs.
Let’s go deep and see a little overview of the dashboard types that Domotz offers.
- Network Overview Dashboard: It displays the status of connected devices, network performance metrics, and any active alerts or issues.
This dashboard provides you with a general overview of your network.
- Devices Dashboard: Find here detailed information about individual devices on your network. It can display device-specific data such as IP address, MAC address, vendor information, and connection status.
This dashboard can help you identify and troubleshoot problems with specific devices.
- Network Performance Dashboard: This dashboard focuses on monitoring the performance of your network. It provides real-time and historical data on network bandwidth usage, latency, packet loss, and other performance metrics.
You can use this information to identify network bottlenecks or performance issues.
From all these tables, you can directly access each device’s settings and quickly get remote access. This feature enables users to access and control devices on their network remotely.
Domotz constantly introduces new features and updates. Check our website for the most up-to-date information on network monitoring capabilities and dashboard features.
Domotz network monitoring dashboards from static to dynamic
Domotz network monitoring dashboards constantly evolve, introducing new features and capabilities. To clarify, we can define our monitoring dashboards as dynamic.
We’ll share an example to explain better what a dynamic dashboard means.
You need to monitor all your switches with specific pre-configured SNMP sensors active. The first step will be to create a specific table that allows real-time monitoring. To put it differently, you’ll be able to keep essential variables under control, such as inbound traffic.
As a result, you’ll be able to react if specific values appear suspicious before any negative scenarios occur.
What happens if other devices of the same type (for instance, more than one switch) will connect to the monitored network? It’s easy. The table will automatically update, showing the existing and recently added devices. The potential is high, as it will be very easy to maintain a high level of monitoring, and information loss is reduced to zero.
We are sure you are curious about what are the network monitoring tables that MSPs mostly use. Keep reading to understand more.
The top 5 network monitoring dashboards most frequently created by MSPs
Here is a list of the most frequent network monitoring dashboards that MSPs need to create:
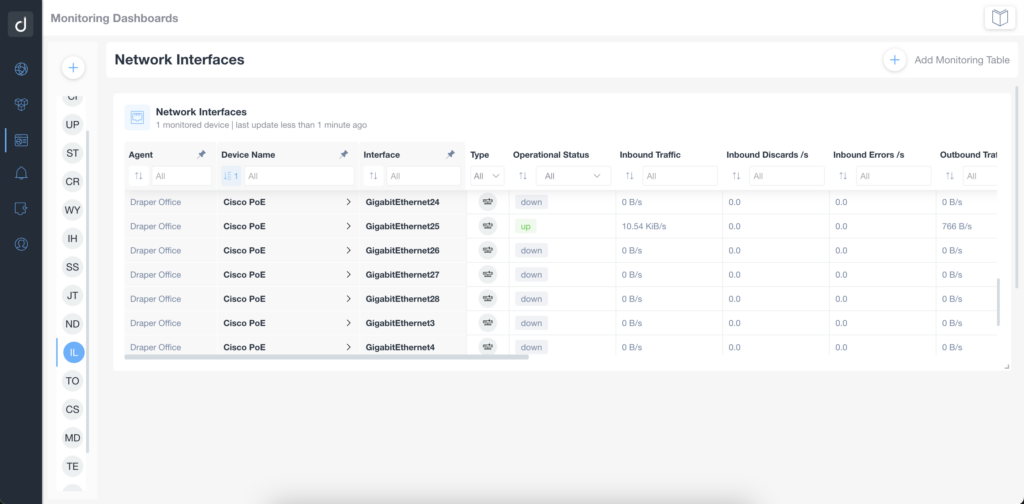
1. Network Interfaces
Such type of table is perfect if you need to monitor and manage the network traffic, performance, and connectivity of various devices within a network. The reason is simple, Domotz will allow you to monitor and troubleshoot network interface issues proactively.
In case of any network device supporting IF-MIB for the Interfaces statistics via SNMP, the Network Interfaces Table template contains the following columns:
- Interface name
- Operational Status
- Inbound (Traffic, Discards, Errors)
- Outbound (Traffic, Discards Errors)
- NIC Type, Admin status
- Physical Address (MAC)
- MTU
- Speed
We also offer other columns for specific models. For example, if you have a Cisco switch, you can also manage and monitor the Power Supply Status or the Fan status.
Creating a monitoring table focusing on the Network Traffic information is helpful for several reasons.
Last but not least, this template allows you to collect and analyze network traffic data over time. Such data is valuable for capacity planning. Most of all, it helps you better understand peak traffic times and potential areas where you might need to upgrade and optimize network resources.
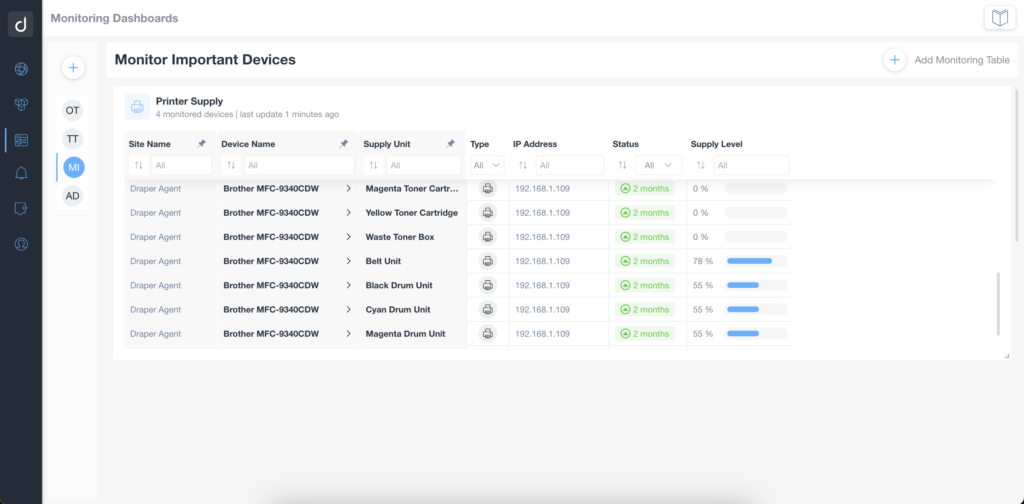
2. Printer Supply
Use the Printer Supplies Table template when you want to monitor and manage the supplies and consumables of all the printers on your network. This template allows you to keep track of various printer-related information, such as ink or toner levels, maintenance kit status, and other supply levels.
3. Vendors’ specific SNMP sensors
Create specific tables for Synology, Cisco, and WatchGuard devices.
In the case of WatchGuard Firewall, an SNMP Pre-Configured template is available to extract the following properties:
- SysA Software Version
- SysB Software Version
- CPU Utilization
- Memory unused/available
- Currently Active Connections
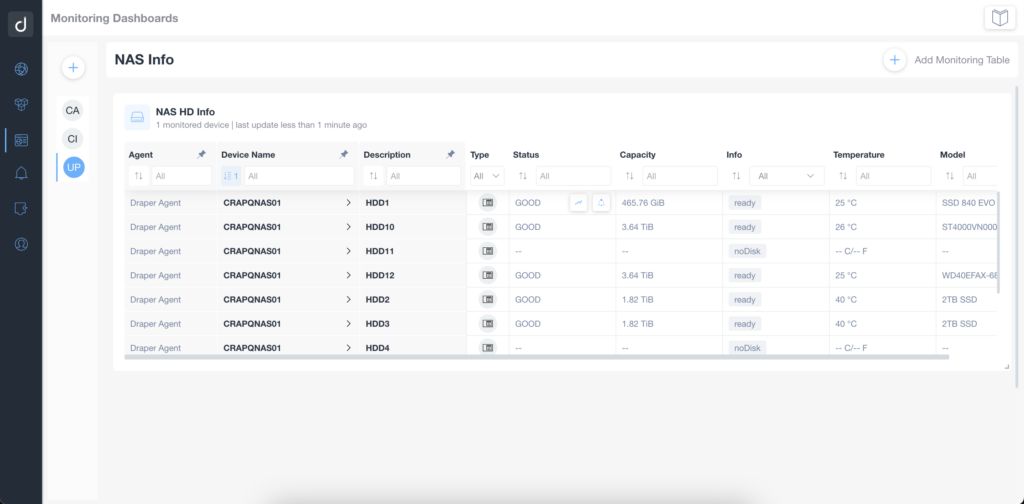
4. NAS Basic Info and Volumes
Using this kind of table can monitor and manage the storage partitions and volumes on your network devices. For example, this template is perfect if you monitor servers, NAS (Network Attached Storage) devices, or storage arrays. These templates allow you to track important information about partitions and volumes, enabling effective storage management.
The NAS Basic Info table contains CPU Usage, CPU Temperature, Total Available Memory, Free Memory, Uptime, System Temperature, Number of Hard disks, Volumes, and Last Error Message.
The NAS Volumes Table template displays:
- Volumes
- Description
- Free Size
- Total Size
- Filesystem
- Status
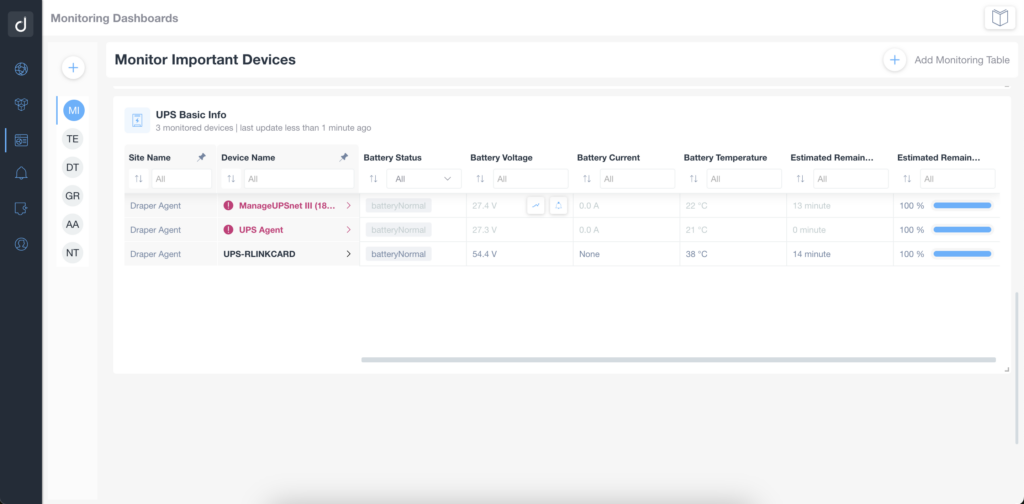
5. UPS Basic Info
Overall, the UPS Basic Info template is helpful when you want to centralize and monitor critical information about your UPS devices. It allows you to track UPS status, battery health, receive alerts, analyze historical data, and generate reports. Utilizing this template helps in ensuring the reliability and effectiveness of your backup power systems.
Here are some situations where you can use the UPS Basic Info template:
- UPS Status Monitoring
- Battery Health and Capacity
- Alarms and Notifications
- Historical Data and Trend Analysis
- Reporting and Documentation
Conclusions
In conclusion, the Domotz network monitoring dashboards are crucial in ensuring efficient and proactive network infrastructure management. It provides real-time monitoring, centralized visibility, and comprehensive insights into various aspects of the networks you monitor. Being able to rely on such dashboards simplifies the monitoring process and enables effective decision-making by relying on several pre-configured SNMP sensors.