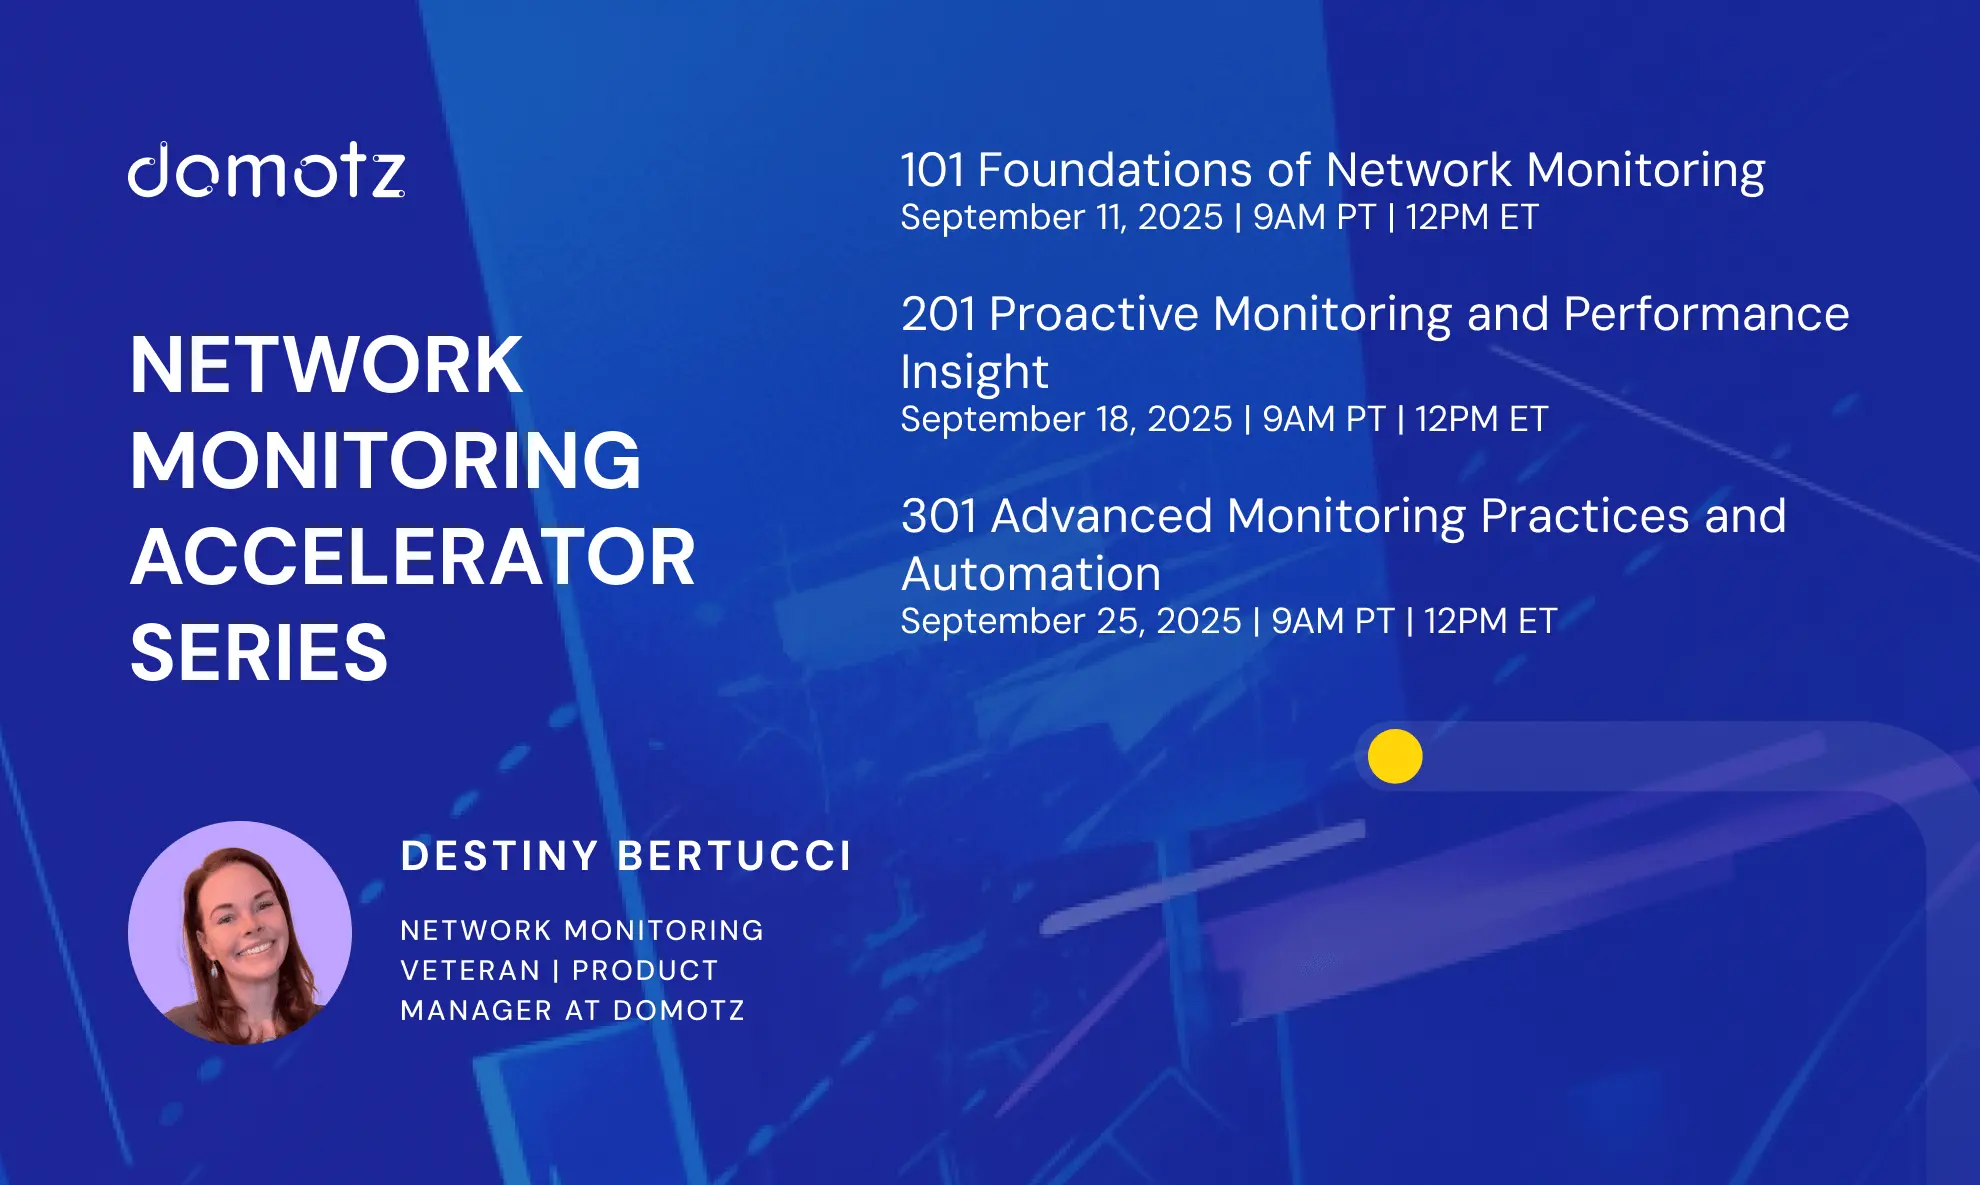
Hello, friends! Destiny Bertucci here again. If you joined us for our second installment of the Network Monitoring Accelerator series, you know we took things up a notch. “Proactive Monitoring and Performance Insight” wasn’t just about visibility—it was about building practices that cut through noise, prioritize what matters, and help you scale monitoring as a discipline.
Did you miss the live event? No problem. View the recording here:
From Alerts to Insight
In our 101 session, we laid the foundation of why monitoring matters. For 201, we focused on the next step: turning raw alerts into meaningful insight. Because let’s face it—too many alerts can be just as bad as none at all.
What does proactive monitoring mean?
- Designing escalation policies that ensure the right person gets notified.
- Using parent/child relationships (router > switch > endpoint) to reduce alert storms.
- Defining thresholds and deltas so you can spot patterns before they escalate.
- Applying event correlation so you’re chasing root causes—not ghosts.
Smarter Monitoring in Practice
No matter which tool you use, the principles of a smart network monitoring tool are universal:
- Discovery: Map devices, dependencies, and baselines so you know what “normal” looks like.
- Alerting: Filter noise so only the most relevant issues hit your radar.
- Escalation: Define who gets notified, when, and how—so nothing critical slips through the cracks.
- Correlation: Suppress downstream noise and connect related events for faster troubleshooting.
Together, these practices shift monitoring from reactive firefighting into proactive performance management.
Key Takeaways
Here are the highlights from NMS Accelerator: 201 – Proactive Monitoring and Performance Insight:
- Smarter alerting is essential—alerts should inform, not overwhelm.
- Escalation policies matter—set rules so alerts don’t get ignored.
- Parent/child mapping saves time—understand dependencies and cut down false alarms.
- Correlation reduces noise—look at events together, not in isolation.
- Proactive beats reactive—monitor deltas, not just thresholds, to catch issues earlier.
Series Lookback: Q&A
We closed out the session with some excellent questions from the community. Here are a few highlights:
- Data & Dashboards : Attendees wanted to know more about dashboard visualizations, troubleshooting views, and what’s on the roadmap for richer performance insights. – Absolutely customize your dashboard to critical services and metrics to use for quick awareness.
- Resource Monitoring: There was discussion about the practical use of CPU/RAM alerts and how they can be leveraged for proactive infrastructure improvement. – When you can define an anomaly, you need to look at the device in question ask questions like: “whats been installed” “updates” “traffic awareness” “Is there a new service being provided or housed on this device” “Has a configuration changed”.
- Expanded Device Coverage: Many asked about support for additional device types (e.g., UPS systems, door access controls) and the ability to create reusable monitoring profiles for SNMP-based devices.- Domotz teams are actively working on an have betas in progress templates to be created and applied for devices.
- Topology & Multi-Site Views: Questions centered around multi-site client management, VLAN and VPN visibility, network topology enhancements (manual connections, SNMP status indicators), and hierarchical organization views. – Domotz is actively working on better visualization of multi-site client management. Pay attention to our release notes!
- Alerts & Security: Several attendees asked about new device alerts, IP conflict detection, and better ways to flag potentially suspicious activity like VPN-based intruders. – We currently make you aware of new devices!
- Integrations: Requests came in for expanded notification options, including support for new chat site outside of current ones as an alerting channel. – We’re always listening to your needs, if one of the ones we have now, which is many, do not meet your needs please let support know so we can have a feature request.
These questions show the community’s focus on scaling monitoring beyond basics—with a strong appetite for better visualization, automation, and integration.
Up Next: Advanced Practices
In our next webinar, NMS Accelerator: 301 – Advanced Monitoring Practices and Automation, we’ll explore how to take these principles even further—integrating with your IT ecosystem, automating remediation, and adopting best practices that scale with your business.


