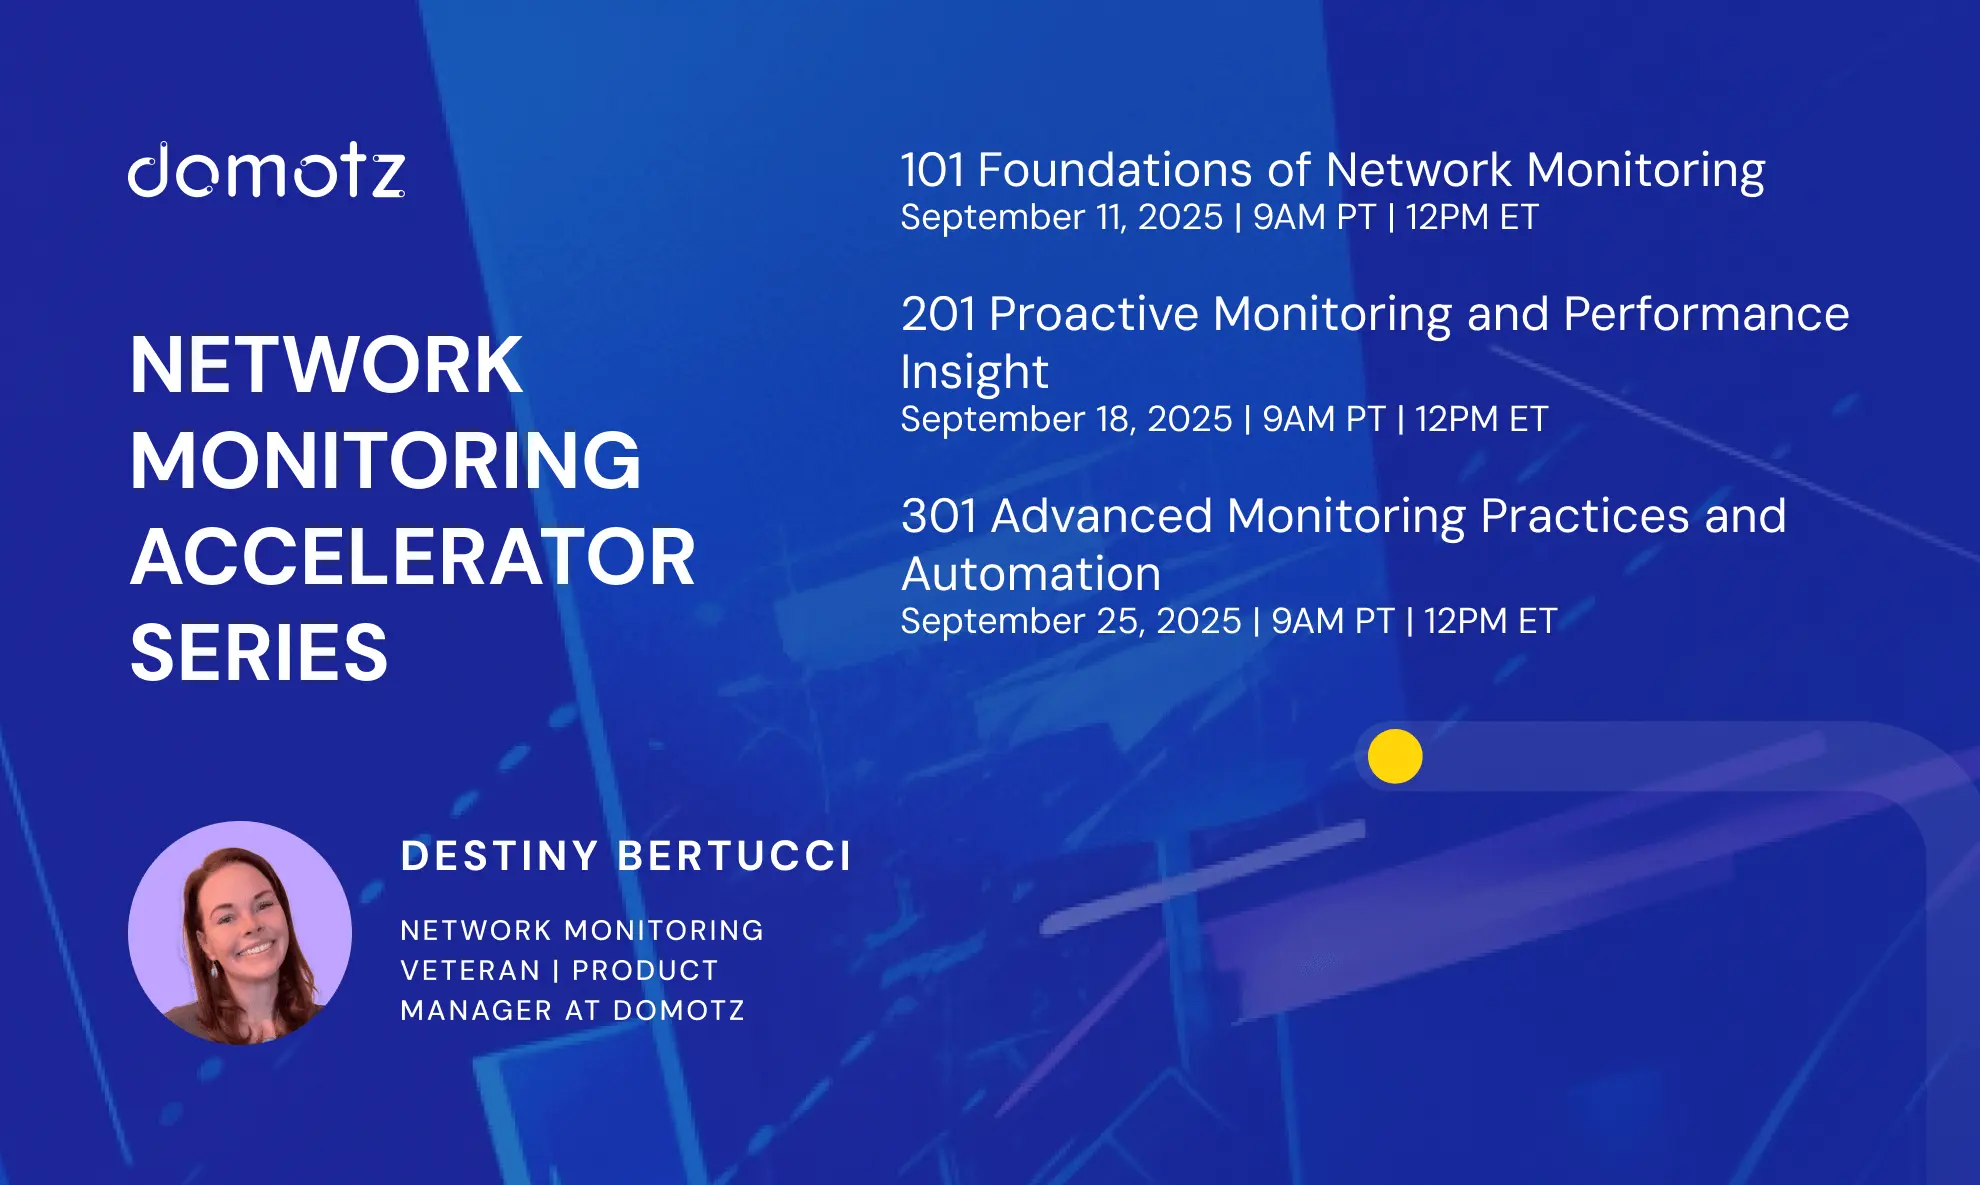
Hello, friends! Destiny Bertucci here. We’ve completed the final installment of our Network Monitoring Accelerator series. In the 301 session, we leveled up by moving beyond problem detection into automation, correlation, and proactive monitoring practices that scale.
If you missed the live event, don’t worry. You can watch the full recording here:
Why Advanced Monitoring Matters
By this point, you know the foundations (101) and how to fine-tune your monitoring for smarter results (201). At the advanced level, monitoring transforms into a strategic enabler.
Instead of chasing alerts, you can:
- Cut through noise with smarter alerting and escalation.
- Suppress downstream alerts using parent/child relationships.
- Correlate related events into one actionable incident.
- Automate remediation with PSA ticketing, webhooks, and integrations.
- Tie monitoring back to business outcomes and client success.
Key Takeaways from 301
Here are the highlights from NMS Accelerator: 301 – Advanced Monitoring Practices and Automation:
- Smarter Alerting: Implement policies that escalate the right issues to the right people, while filtering out false positives.
- Parent/Child Relationships: Reduce alert storms by defining hierarchies (router → switch → endpoint).
- Event Correlation: Consolidate repeated events into a single incident to speed up root cause analysis.
- Automation: Use Domotz integrations to automatically generate tickets, trigger workflows, and remediate common problems.
- Best Practices: Monitor deltas, baseline normal behavior, and ensure alerts provide detailed, actionable information.
Audience Q&A Highlights
We closed out the session with some excellent questions from the community. Here are a few highlights:
Q: How can alerting integrate with PSAs?
A: Domotz integrates directly with platforms like ConnectWise and Autotask. Alerts can auto-create tickets with diagnostics attached, categorized correctly, and routed to the right technician, cutting response time and keeping SLA compliance in check.
Q: What about APIs and webhooks?
A: Domotz provides an API-first approach with webhook support, enabling custom automation. For example, you can send Domotz alerts directly into Slack or Teams, trigger scripts via Node-RED, or kick off downstream automation workflows unique to your business or client vertical.
Q: Can I integrate Power BI for dashboards?
A: Yes! Domotz offers a native integration that allows you to pipe monitoring data into Power BI to build custom, client-facing dashboards. This is especially valuable for MSPs who want to show their customers real-time uptime, SLA performance, or historical trend data in a format they already use for reporting.
Wrapping Up: From Firefighting to Leadership
301 is about transformation. With Domotz, you can move beyond reactive troubleshooting and position monitoring as a business enabler:
- Automating first-response actions.
- Proactively preventing downtime.
- Demonstrating value with client-facing dashboards.
Whether you’re an internal IT team or an MSP managing multiple sites, advanced practices help you deliver consistency, reduce noise, and scale without adding headcount.

