Network faults don’t announce themselves politely. A switch goes unresponsive at 2 a.m., a broadcast storm silently saturates a client’s LAN, or a misconfigured VLAN starts dropping packets on a Monday morning. By the time someone opens a ticket, the damage is already in motion.
The difference between a 10-minute fix and a 4-hour outage usually comes down to one thing: the quality of your network fault management software. Not just whether you have monitoring, but whether your tools detect the right signals, suppress the noise, trace the root cause, and get the right person working on the right problem fast.
This guide covers the top 10 network fault management solutions for 2026. We break down what each tool actually does for fault detection, alerting, and root cause analysis so you can make an informed decision for your team, your clients, or your infrastructure.
Table of contents
What Is Network Fault Management?
Network fault management is the process of detecting, isolating, and resolving faults in a network infrastructure before they cause service disruption, or after they already have. A fault is any condition that impairs the expected operation of a network device or service: a failed interface, a spanning tree topology change, a device going offline, or bandwidth saturation from a loop.
Effective fault management does four things: it detects the problem (often before users notice), isolates the root cause rather than just the symptom, triggers the right response (automated or human), and documents the event for post-mortem analysis.
The FCAPS Model: A Framework for Network Management
The FCAPS model, developed by the ISO, defines five functional areas of network management. Fault management is the F, and it is the one that keeps NOC teams employed.
- Fault: Detecting, isolating, and correcting abnormal network conditions
- Configuration: Tracking device configurations and changes
- Accounting: Measuring usage for billing and capacity planning
- Performance: Monitoring metrics like latency, throughput, and packet loss
- Security: Controlling access and detecting intrusions
Most modern network fault management platforms address several FCAPS areas simultaneously. The tools in this list focus heavily on Fault and Performance, with varying degrees of Configuration and Security coverage.
The Business Cost of Network Faults
Downtime is expensive by any measure. Industry data consistently puts the cost of unplanned network downtime at over $1,600 per minute for mid-sized organizations, and significantly higher for enterprises in finance, healthcare, or e-commerce. Beyond direct revenue impact, there is the productivity loss, the client trust erosion for MSPs, and the engineering hours spent on reactive troubleshooting instead of planned work.
The shift from reactive to proactive fault management is where real operational gains happen. Organizations that implement automated monitoring and alerting consistently report reductions in Mean Time to Detect (MTTD) of 40 to 60 percent and MTTR reductions of 40 percent or more within the first six months.
Key Capabilities of Modern Network Fault Management Software
Not all monitoring tools handle fault management equally. When evaluating options, focus on these core capabilities:
Proactive Fault Detection
The tool should detect fault conditions before users report them. This means SNMP polling, ICMP checks, syslog ingestion, and threshold-based alerting that catches problems in their early stages, not just when a device goes completely dark.
Root Cause Analysis
Alert correlation and topology-aware alerting separate modern platforms from older monitoring tools. When a core switch fails, a capable fault management system recognizes that downstream device alerts are caused by that single failure and suppresses the noise. Tools without root cause intelligence generate alert storms that slow response rather than speed it up.
Automated Remediation
The best platforms in 2026 can execute predefined responses to known fault patterns, including restarting a service, isolating a port, or triggering a backup link, without waiting for human intervention. This capability varies significantly across the tools below.
Intelligent Alerting and Escalation
Alert fatigue is cited by NOC teams as their number-one operational pain point. Modern fault management software should support dynamic thresholds, alert deduplication, dependency-aware suppression, and tiered escalation policies.
Integration with ITSM and Ticketing Systems
Fault events need to flow into your incident management workflow. Integrations with ConnectWise, Autotask, ServiceNow, Jira, PagerDuty, and similar platforms determine how quickly your fault management data becomes actionable.
Multi-Site and Multi-Tenant Support
For MSPs and distributed IT teams, fault management needs to work across dozens or hundreds of sites simultaneously, with clear isolation between clients and centralized visibility across all environments.
Network Fault Management Software Comparison Table
Use this table to compare all 10 platforms across the dimensions that matter most before diving into the full reviews.
| Tool | Best For | Deployment | Starting Price | Alert Suppression | Remote Access | MSP Multi-Tenant | Free Trial |
|---|---|---|---|---|---|---|---|
| Domotz | MSPs, distributed IT | Cloud SaaS | $1.50/device/mo | Event Dependency | Built-in, no VPN | Full | 14-day |
| ManageEngine OpManager | Mid-to-large enterprise | On-premises | From $245/yr | AI alarm correlation | Via add-on | Limited | Free 3-dev |
| Auvik | MSPs, topology-first | Cloud SaaS | Quote-based | Smart Alert Suppression | No | Full | 14-day |
| SolarWinds NPM | Large enterprise NOC | On-prem / SaaS | ~$7/node/mo | Conditional alerts | Via add-ons | Limited | 30-day |
| PRTG | SMB / mid-market IT | On-prem / Cloud | Free (100 sensors) | Dependency-based | No | No | 30-day |
| LogicMonitor | Enterprise AIOps | Cloud SaaS | $16/unit/mo | Edwin AI, up to 90% | No | Add-on | 14-day |
| Zabbix | Linux-savvy, budget | Self-hosted | Free / $50/mo Cloud | Dependency trees | No | No | Cloud trial |
| Nagios XI | SMB perpetual license | On-premises | From $2,595 | Manual dependency | No | No | 60-day |
| Site24x7 | SMB unified stack | Cloud SaaS | $9/mo | Threshold-based | No | MSP plan | 30-day |
| Cisco Catalyst Center | Cisco-only enterprise | On-prem appliance | ~$125,800 appliance | MRE AI engine | Cisco TAC | No | No |
Top 10 Network Fault Management Software for 2026
1. Domotz
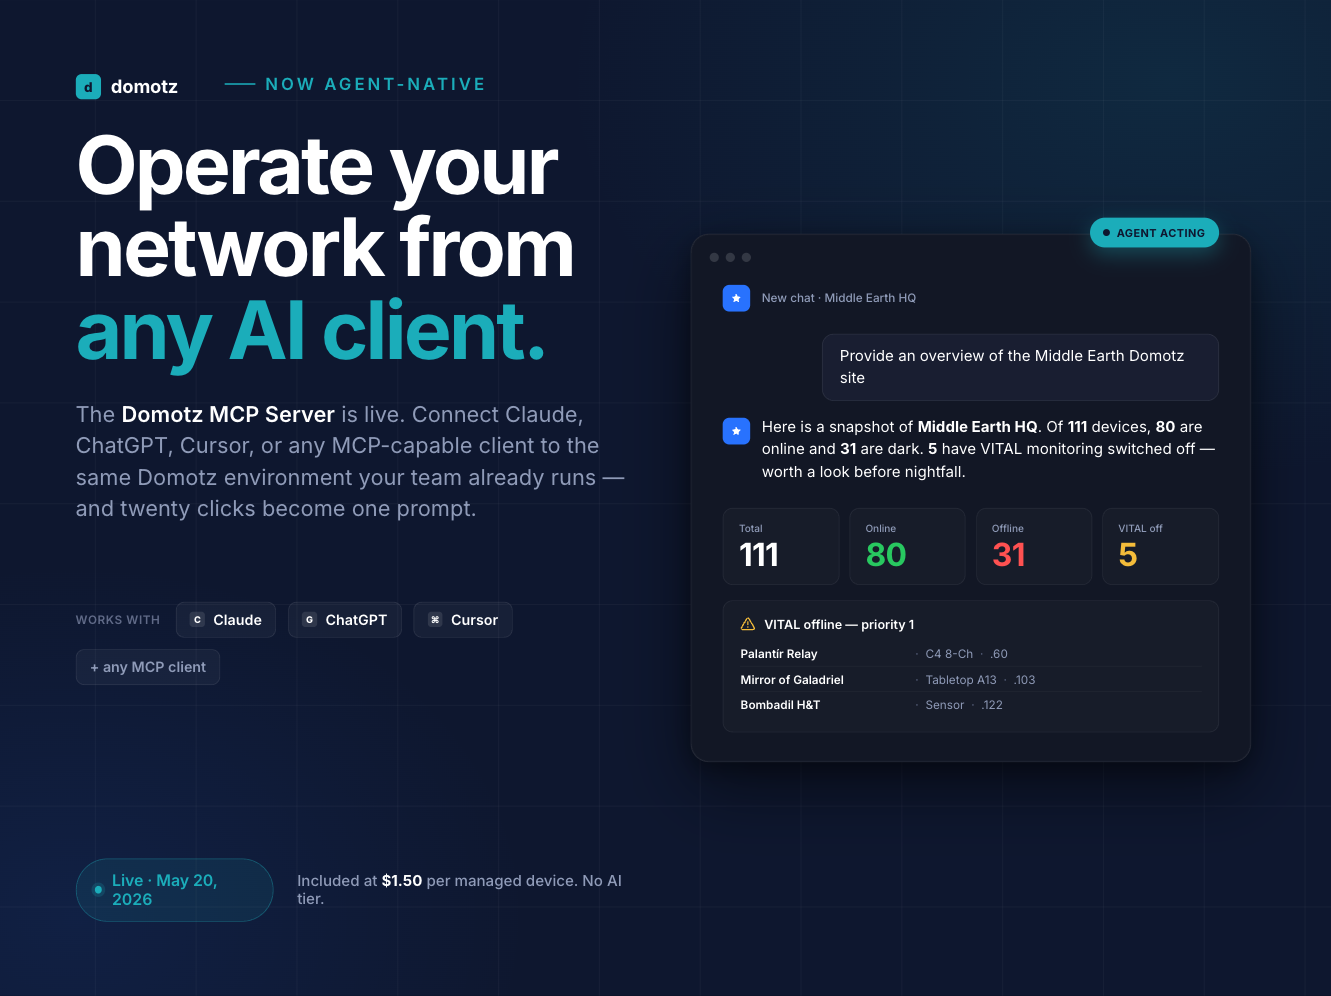
Domotz is a cloud-based network monitoring and management platform built specifically for MSPs, IT service providers, and distributed IT teams. Founded on the principle that professional-grade network management should be accessible without enterprise-level complexity or cost, Domotz has become a go-to platform for teams that need to manage dozens or hundreds of client sites from a single pane of glass. Its architecture is purpose-built for distributed environments, with a lightweight on-site agent that deploys in under 15 minutes and a cloud dashboard that centralizes visibility across every site.
Fault management in Domotz works through a combination of SNMP monitoring (v1/v2/v3), ICMP checks, and event-driven alerting with customizable thresholds. The Event Dependency feature lets teams configure dependency relationships between devices so that downstream alerts are suppressed when a root cause event is already being tracked, directly addressing the alert storm problem that plagues NOC teams using less capable tools. The January 2026 Topology Snapshot feature adds the ability to freeze topology views for stable troubleshooting reference points, while VLAN auto-discovery surfaces misconfigured network segments that are often the source of fault conditions. Where Domotz stands apart from most tools in this category is built-in remote access: RDP, SSH, HTTP/HTTPS, and Telnet are all available without VPN, so when a fault is detected, the responding engineer can access the affected device immediately without additional tooling.
Best for: MSPs and IT teams needing practical, affordable fault management across distributed environments
Key Fault Management Features: Customizable threshold alerting, event dependency for alert suppression, rogue device detection, SNMP trap processing, topology-aware visualization, configuration backup and change detection, automated network topology mapping, multi-site NOC dashboard, PSA integrations (ConnectWise, Autotask, HaloPSA), bulk alerting, and RBAC for team-based access control.
Pricing: $1.50 per managed device per month, sold in groups of 10 ($15/month minimum). All features included with no tiers and no add-ons. Free tier includes 1 managed device plus unlimited discovery. 14-day free trial, no credit card required.
Ratings: Capterra 4.9/5 (125 reviews, 99% positive) | G2 4.8/5 | SourceForge 4.9/5
Pros: Most transparent and affordable pricing in the category; 15-minute deployment; built-in remote access without VPN; remote power management; excellent MSP multi-site architecture; responsive customer support; strong device discovery across heterogeneous environments.
Cons: VLAN monitoring has some limitations per agent in larger environments; lacks the deep enterprise analytics of enterprise-tier tools; web interface speed occasionally cited in reviews.
2. ManageEngine OpManager
ManageEngine OpManager is an on-premises network fault management platform from Zoho’s IT arm, trusted by over 42,000 customers across mid-market and enterprise environments. It sits in a unique position in the market: comprehensive enough to satisfy large IT departments but priced accessibly enough for teams that cannot justify the cost of a SolarWinds or LogicMonitor deployment. Its device-based licensing model is predictable and still available in perpetual form, which is increasingly rare in 2026.
OpManager’s fault management stands out for its native STP port monitoring, which displays port-level spanning tree status directly from any switch’s device snapshot. Its AI-powered adaptive thresholds and dependency-aware alarm correlation reduce alert noise intelligently. When a parent device fails, dependent device alerts are automatically correlated rather than generating independent incidents. The platform monitors over 2,000 performance metrics across 10,000-plus device types. For root cause analysis, OpManager’s alarm correlation engine maps fault events to network topology context, helping engineers identify whether an alert is a primary failure or a downstream consequence. Workflow automation allows teams to configure automated responses to common fault patterns.
Best for: Mid-to-large enterprises needing comprehensive on-premises fault management
Key Fault Management Features: AI-powered adaptive thresholds, native STP port monitoring, automated L2 topology mapping, alarm correlation for root cause analysis, workflow automation, SNMP trap processing, syslog analysis, multi-vendor support for 10,000-plus devices, and configurable escalation policies.
Pricing: Device-based licensing. Essential 10 devices: $245/year. Essential 50 devices: $595/year. Enterprise 100 devices: $1,995/year. Enterprise 250 devices: approximately $7,995/year. Free edition for 3 devices. Both perpetual and subscription licensing available.
Ratings: G2 4.5/5 | Capterra 4.6/5 | Gartner Peer Insights 4.4/5
Pros: Native STP monitoring built in; AI-powered alerting with alarm correlation; cost-effective device-based licensing; no forced subscription migration (perpetual still available); scales from SMB to enterprise.
Cons: Primarily on-premises; STP monitoring is on-demand rather than continuous trending; advanced features require the Enterprise edition; add-ons such as NCM, NetFlow Analyzer, and IPAM are separate paid products; UI can lag in large deployments.
3. Auvik
Auvik is a cloud-based IT management platform built for MSPs, with network discovery and topology mapping as its core strengths. Originally launched in 2011 and now part of Vista Equity Partners’ portfolio, Auvik has built a strong reputation among MSPs for the speed and accuracy of its automated network mapping capabilities. It consistently ranks among the top tools in the network management space and carries the highest G2 rating in the Network Management Solutions category.
Auvik’s fault management strengths center on automated network discovery, real-time topology mapping, and 64-plus pre-configured alerts covering a wide range of fault conditions out of the box. Auvik’s Smart Alert Suppression, released in 2025, reportedly reduced alert volume for users by up to 80 percent. The platform supports 15,000-plus device types from 700-plus vendors. TrafficInsights provides NetFlow-based traffic analysis, particularly useful for diagnosing bandwidth-related fault conditions. The spanning tree change alert fires out of the box with no configuration required, providing immediate visibility into STP topology changes that commonly precede fault conditions.
Best for: MSPs needing automated topology mapping and traffic-aware fault visibility
Key Fault Management Features: 64-plus pre-configured alerts, Smart Alert Suppression (up to 80% alert reduction, vendor-reported), real-time auto-updating topology maps, STP topology change alerts, NetFlow traffic analysis, configuration backup with version comparison, in-app SSH/Telnet terminal, PSA integrations, and ServiceNow CMDB connector (December 2025).
Pricing: Per-device, quote-based and not publicly listed. Two tiers (Basic and Core). Network devices carry the highest cost; edge devices and many device types including APs, printers, IoT, and UPS are monitored free. Custom quotes required. 14-day free trial available.
Ratings: G2 4.5/5 (381 reviews, #1 in Network Management Solutions) | PeerSpot 8.8/10 | TrustRadius approximately 9.0/10
Pros: Best-in-class automated topology mapping; excellent MSP multi-site architecture; strong pre-configured alerts; Smart Alert Suppression reduces noise significantly; TrafficInsights for traffic-related fault analysis; fast deployment.
Cons: Pricing not publicly listed and described as expensive by many reviewers; cost escalates quickly for larger environments; no mobile app; cloud-only deployment; device misidentification requires manual correction.
4. SolarWinds Network Performance Monitor
SolarWinds has been a dominant name in enterprise network management for over two decades, and its Network Performance Monitor remains the benchmark for deep network fault analytics at scale. The platform grew through a combination of genuine technical capability and aggressive acquisition strategy, becoming the de facto standard in enterprise NOC environments. Its community resources, documentation depth, and integration ecosystem reflect that long-term investment.
For fault management, SolarWinds offers SNMP trap and syslog processing configured to surface loop-related events, topology change notifications, and device-specific fault conditions. The conditional alert engine allows sophisticated escalation policies. NetPath provides hop-by-hop path analysis and PerfStack enables cross-stack correlation, providing fault visibility at a level of detail that few tools match. The context for evaluating SolarWinds in 2026 has changed significantly: following the Turn/River Capital acquisition in February 2025 and the elimination of perpetual licensing as of August 2025, customers report renewal price increases of 200 to 300 percent, and the platform now requires 3-year subscription commitments.
Best for: Large enterprises with dedicated NOC teams and complex multi-vendor environments
Key Fault Management Features: NetPath hop-by-hop path analysis, PerfStack cross-stack correlation, SNMP trap and syslog processing, intelligent topology mapping, advanced conditional alerting, STP data visibility, and extensive Cisco integration.
Pricing: SaaS approximately $7/node/month. Perpetual licensing eliminated as of August 2025. 3-year subscription commitments required. Customers report 200 to 300 percent renewal increases post-acquisition.
Ratings: G2 4.3/5 | Capterra 4.5/5 | Gartner Peer Insights 4.3 to 4.5/5
Pros: Industry-leading deep analytics; NetPath and PerfStack provide fault correlation at enterprise scale; massive enterprise scalability; strong community resources; comprehensive multi-vendor protocol support.
Cons: Aggressive post-acquisition price increases; mandatory 3-year commitments; Windows Server-only on-premises deployment; NetFlow analysis requires a separate NTA module; reputation still affected by the 2020 SUNBURST supply chain incident.
5. PRTG Network Monitor (Paessler)
PRTG Network Monitor is a Paessler product with roots going back to 1997, making it one of the longest-running names in network monitoring. Its sensor-based architecture distinguishes it from nearly everything else in the category: rather than managing devices as the primary unit, PRTG manages individual sensors, where each sensor monitors a specific metric on a specific device. This gives it unusual flexibility and makes it particularly useful for environments with non-standard devices or monitoring requirements that do not fit neatly into predefined templates.
With 250-plus predefined sensor types covering SNMP, WMI, NetFlow, syslog, SSH, HTTP, and packet sniffing, teams can instrument virtually any device or metric relevant to fault detection. The Syslog Receiver sensor captures STP topology change events in real time. SNMP Library Sensors with vendor-specific MIBs allow custom fault monitoring for specific device types. All features are included in every license tier, with the only variable being sensor count. The major shift for 2026: Paessler moved to subscription-only licensing in mid-2024, requiring 3-year commitments, which generated significant customer backlash.
Best for: SMBs and mid-market IT teams needing flexible, sensor-based fault monitoring
Key Fault Management Features: Syslog Receiver for STP event capture, SNMP trap processing, bandwidth spike detection, custom MIB-based sensor configuration, multi-channel alerting (email, SMS, push, HTTP), dependency-based alert suppression, and distributed monitoring with remote probes.
Pricing: Free tier at 100 sensors. PRTG 500: $2,149/year. PRTG 1000: $3,899/year. PRTG 2500: $8,099/year. PRTG 5000: $14,199/year. PRTG 10000: $17,899/year. 3-year subscription terms now standard.
Ratings: G2 4.5/5 | Capterra 4.5/5 | Gartner Peer Insights 4.5/5 (828 reviews, 91% willing to recommend)
Pros: All features included in every tier; excellent breadth of sensor types; free 100-sensor tier for evaluation; strong multi-channel alerting; dependency-based alert suppression; proven reliability.
Cons: Subscription mandate since mid-2024 increased costs significantly; sensor-based licensing makes cost estimation difficult; Windows Server required for on-premises deployment; no native MSP multi-tenant architecture; topology maps require manual configuration rather than auto-discovery.
6. LogicMonitor
LogicMonitor is a cloud-native infrastructure monitoring platform that has made AIOps its core differentiator. Backed by significant enterprise investment and with a customer base that skews toward mid-to-large organizations managing complex hybrid infrastructure, LogicMonitor has positioned itself as the monitoring platform for environments where static thresholds and manual tuning are no longer sufficient. TechRadar named it the number-one network monitoring pick for 2025, and its December 2025 acquisition of Catchpoint added internet performance monitoring and synthetic testing capabilities to the platform.
LogicMonitor’s Edwin AI engine is the most mature AIOps implementation in this comparison for pure fault management. Dynamic baselines learned from actual network behavior replace static thresholds, eliminating a major source of false positives and missed detections. ML-driven anomaly detection identifies fault trajectories such as increasing latency, memory exhaustion, and error rate spikes before they become outages. Alert noise reduction of up to 90 percent is vendor-claimed but consistent with published customer reviews. Its SaaS architecture uses lightweight on-premises collectors, requires no dedicated server infrastructure, and deploys in hours rather than days.
Best for: Mid-to-large enterprises needing AIOps-powered fault management with ML-driven alerting
Key Fault Management Features: Edwin AI dynamic baseline learning, ML-driven anomaly detection, automated root cause analysis, alert noise reduction up to 90% (vendor-reported), real-time topology maps, NetFlow/sFlow/IPFIX built-in, 3,000-plus integrations, automated runbook execution, and agentic AIOps capabilities.
Pricing: Per Hybrid Unit/month. Essentials: $16/unit/month (up to 999 units). Advanced: $27/unit/month. Signature with Edwin AI: $53/unit/month. Average annual contract approximately $36,000. 14-day free trial.
Ratings: G2 4.5/5 (716 reviews, Enterprise Grid Leader) | Capterra 4.6/5 | TrustRadius 9.0/10 | Gartner Peer Insights 4.6/5
Pros: Most advanced AIOps fault detection in the category; dynamic thresholds eliminate manual tuning; fast SaaS deployment; excellent scalability; Catchpoint acquisition adds digital experience fault monitoring; customers report 46% MTTR reduction.
Cons: Premium pricing not suited for SMBs; Edwin AI requires the Signature tier; learning curve for advanced customization; reporting less robust than some legacy tools; not a full RMM platform.
7. Zabbix
Zabbix is an open-source network monitoring platform that has been in active development since 2001. Maintained by Zabbix LLC and a large global contributor community, it carries the distinction of being the only enterprise-capable monitoring platform in this list with a $0 licensing cost. Its user base spans thousands of organizations across every industry and size tier, from small businesses running Zabbix on a single server to government agencies and telcos monitoring hundreds of thousands of hosts. The upcoming Zabbix 8.0 LTS, planned for 2026, will add OpenTelemetry integration and native NetFlow collection.
For fault management, Zabbix offers highly configurable SNMP-based monitoring, custom trigger expressions for specific fault conditions, and a flexible notification system that supports email, SMS, Slack, Teams, PagerDuty, and custom scripts. Dependency trees allow alert suppression when a parent host is confirmed down. The trade-off is operational overhead: a production Zabbix deployment requires Linux server administration, database tuning, and proxy architecture planning, and setup takes weeks for a well-configured environment. For those without the in-house Linux expertise, the managed Zabbix Cloud option starts at $50/month.
Best for: Cost-conscious organizations with Linux expertise wanting enterprise-grade fault monitoring at no licensing cost
Key Fault Management Features: Custom trigger expressions for fine-grained fault conditions, dependency-based alert suppression, SNMP v1/v2/v3 support, syslog monitoring, multi-channel notification engine, distributed monitoring via proxies, high scalability to tens of thousands of hosts, and a large template library for common network hardware.
Pricing: Fully free and open-source (AGPLv3). Zabbix Cloud from $50/month. Commercial support available across 5 tiers, priced per Zabbix server/proxy.
Ratings: G2 4.3/5 | Capterra 4.7/5 (110 reviews) | PeerSpot 8.4/10 (#1 in Network Monitoring)
Pros: Zero licensing cost with no feature restrictions; extremely customizable; scales from small deployments to 100,000-plus hosts; strong community and template library; no vendor lock-in; Zabbix Cloud available for managed deployment.
Cons: Steep learning curve; requires Linux administration and database management; network topology maps must be manually constructed; UI improving but still considered dated; no native NetFlow until 8.0 LTS; self-hosting requires ongoing maintenance investment.
8. Nagios XI
Nagios has been a fixture in network and infrastructure monitoring since the late 1990s, making it one of the oldest actively maintained monitoring platforms still in wide use. Nagios Core, the open-source foundation, spawned the commercial Nagios XI product, which adds a web UI, reporting, wizards, and enterprise support on top of the proven Nagios engine. Its 25-plus year track record and plugin ecosystem of over 4,000 community contributions have made it a default choice in environments where proven reliability and extensibility matter more than modern UX.
Nagios XI stands out in 2026 for a straightforward reason: it still offers perpetual licensing. In a market where SolarWinds and PRTG have forced customers into subscription models, that one-time purchase model represents genuine commercial differentiation for budget-conscious organizations or those with multi-year hardware refresh cycles. Its strength is that plugin ecosystem, enabling monitoring of virtually any device, protocol, or fault condition. The 2026 release added Smart Dashboards with treemaps, heatmaps, and gauge visualizations that improve fault status visibility.
Best for: Organizations needing proven, customizable fault monitoring with perpetual licensing
Key Fault Management Features: SNMP-based fault monitoring, configurable threshold alerting, multi-channel escalation (email, SMS, Slack, Teams, PagerDuty, ServiceNow), plugin-based extensibility for custom fault checks, event handlers for automated responses, and dependency definitions for alert suppression.
Pricing: Nagios Core is free and open-source. Nagios XI Standard: $2,595 for 100 nodes, $8,295 for 500 nodes, $14,995 for 1,000 nodes. Enterprise edition adds $2,095 for SLA reports and capacity planning. Annual maintenance renewal required.
Ratings: Capterra 4.0/5 | Gartner Peer Insights 4.0 to 4.3/5 (250 reviews) | PeerSpot 8.0/10
Pros: Perpetual licensing available; massive plugin ecosystem; 25-plus years of proven reliability; cost-effective for smaller environments; strong alerting and escalation policies; integrates well with major ITSM tools.
Cons: No native network topology detection; complex initial setup with steep learning curve; dated UI; no auto-discovery in Core; mindshare declining as cloud-native tools gain traction; Linux-only server requirement.
9. Site24x7
Site24x7 is a cloud-native unified monitoring platform from the ManageEngine/Zoho ecosystem. Unlike most tools in this comparison that are purpose-built for network monitoring, Site24x7 takes a breadth-first approach, covering website uptime, server health, application performance, network devices, and cloud infrastructure under a single subscription. That breadth-per-dollar ratio is its primary competitive advantage, and it earned Gartner Peer Insights Customer Choice recognition in 2025.
For network fault management specifically, Site24x7 supports SNMP monitoring across 11,000-plus device types, NetFlow traffic analysis, and configuration management. Threshold-based alerting with multi-channel notifications covers standard fault detection scenarios. The MSP plan, starting at $45/month for 9 customer accounts, provides basic multi-tenant management capabilities. Where Site24x7 falls short for advanced fault management is depth: multi-tenant management, remote device access, and PSA integrations are less mature than platforms purpose-built for MSPs, and root cause analysis is less sophisticated than LogicMonitor or SolarWinds.
Best for: SMBs and mid-market teams needing unified cloud-native monitoring across network, server, and application layers
Key Fault Management Features: SNMP monitoring for 11,000-plus device types, threshold alerting, NetFlow analysis, configuration management, multi-channel alerting, downtime root cause analysis, SLA management, and cloud infrastructure monitoring across AWS, Azure, and GCP.
Pricing: Starts at $9/month for basic monitoring. Professional plan at approximately $42 to $49/month includes 5 servers, 20 websites, and 10 network devices. MSP plan from $45/month for 9 customer accounts. Annual billing.
Ratings: G2 4.5/5 | Gartner Peer Insights Customer Choice 2025 | Capterra positive ratings across multiple reviews
Pros: Excellent monitoring breadth across network, server, and application layers at low cost; cloud-native SaaS architecture; easy setup; strong cloud monitoring for AWS, Azure, and GCP; Gartner Customer Choice recognition.
Cons: Multi-tenant management less mature than Domotz or Auvik for MSPs; no built-in remote device access; root cause analysis less sophisticated than enterprise tools; advanced network fault analytics require add-ons.
10. Cisco Catalyst Center
Cisco Catalyst Center (formerly Cisco DNA Center) is Cisco’s flagship network management and assurance platform, designed to manage Cisco Catalyst infrastructure from a centralized controller. It is not a general-purpose monitoring tool — it is a purpose-built network operations platform for organizations that have standardized on Cisco Catalyst switching infrastructure and need the deepest possible fault management capabilities within that environment. For qualifying organizations, it delivers capabilities unavailable anywhere else in the market.
The Machine Reasoning Engine (MRE) provides AI-powered automated troubleshooting specifically designed for Layer 2 fault detection, encapsulating expert knowledge to identify root causes autonomously. The Assurance module uses real-time streaming telemetry to detect STP loop issues, MAC address flapping, and broadcast storms. Loop Detection Guard built into Cisco Catalyst switches can error-disable looping ports automatically. Users report completing firmware upgrades across 51 switches in 34 minutes. The constraints are equally significant: Catalyst Center manages Cisco hardware only, the hardware appliance costs approximately $125,800, and total mid-size deployment costs run from $50,000 to $200,000-plus.
Best for: Large enterprises running Cisco-dominant infrastructure needing AI-powered network assurance
Key Fault Management Features: Machine Reasoning Engine for AI-powered Layer 2 fault detection, real-time streaming telemetry, STP loop and MAC flapping detection, broadcast storm identification, automated remediation, AI/ML anomaly detection via Cisco AI Network Analytics, path trace visualization, and deep Cisco TAC integration.
Pricing: Hardware appliance approximately $125,800. Catalyst Essentials: $700 to $900/switch for 3 years. Catalyst Advantage: $1,200 to $1,500/switch for 3 years (required for full AI/ML features). Total mid-size deployment: $50,000 to $200,000-plus.
Ratings: PeerSpot 8.6/10 (#2 Network Management Applications) | Gartner Peer Insights 4.3 to 4.5/5 | G2 4.5/5
Pros: Purpose-built AI fault detection for Cisco environments; Machine Reasoning Engine automates root cause analysis; deep STP monitoring and automated remediation; excellent Cisco TAC integration; significant time savings on network operations tasks.
Cons: Cisco hardware only with no multi-vendor support; extremely expensive; substantial price increases post-rebranding; frequent software bugs reported by reviewers; 7-day data retention limit; 15-minute data lag for WLC monitoring.
How to Choose the Right Network Fault Management Software
The right tool depends on the problem you are actually solving, not just a feature checklist. Here is a practical framework for narrowing down the options:
Define Your Environment First
How many sites? How many devices per site? Single-tenant or multi-tenant (MSP)? On-premises infrastructure or cloud-managed? Cisco-only or multi-vendor? The answers immediately eliminate several options. Cisco Catalyst Center is only relevant for Cisco shops. Nagios and Zabbix require Linux infrastructure. SolarWinds and PRTG require Windows Server for on-premises deployment.
Be Honest About Your Team’s Capacity
Zabbix is powerful and free, but it requires engineering time to build and maintain. LogicMonitor is sophisticated, but its learning curve is real. If your team is stretched thin and needs fault monitoring operational within a day, Domotz (15-minute deployment) or Auvik are better choices than tools that take weeks to configure properly.
Match the Tool to Your Alert Volume Problem
If alert fatigue is your primary pain point, prioritize platforms with strong alert correlation and suppression. Options include LogicMonitor’s Edwin AI, Auvik’s Smart Alert Suppression, ManageEngine’s dependency-aware alarm correlation, or Domotz’s Event Dependency feature. A tool that floods your NOC with noise is not a fault management solution.
Factor in Total Cost of Ownership, Not Just Licensing
SolarWinds and PRTG have moved to subscription models with multi-year commitments and significant renewal increases. ManageEngine and Nagios still offer perpetual licensing. Zabbix has no licensing cost but real infrastructure and staffing costs. Domotz’s transparent $1.50/device/month with no tiers or add-ons makes budget planning straightforward.
Consider What Happens After Fault Detection
Fault management is not just about knowing something is broken. It is about fixing it. Does your tool support remote access to affected devices? Automated remediation for known fault types? Integration with your ticketing system? Domotz’s built-in remote access without VPN and LogicMonitor’s automated runbooks both address the response side of fault management, not just detection.
Frequently Asked Questions
Fault management focuses on detecting, isolating, and resolving abnormal network conditions such as failures, errors, and service disruptions. Performance management focuses on measuring and optimizing normal operating metrics like throughput, latency, utilization, and error rates over time. The two are related: performance degradation often precedes a fault, and fault events affect performance metrics. Modern platforms like Domotz, ManageEngine OpManager, and LogicMonitor address both, using performance monitoring as an early indicator of fault conditions.
Root cause analysis (RCA) in networking is the process of tracing a fault or service degradation back to its original source, distinguishing between the primary failure and its downstream effects. When a core switch fails, RCA identifies that switch as the root cause rather than treating the dozens of unreachable downstream devices as separate incidents. Tools accomplish this through topology-aware alert correlation, dependency mapping, and increasingly through AIOps engines like LogicMonitor’s Edwin AI or ManageEngine’s AI-powered alarm correlation.
Alert fatigue is reduced by combining four practices: implementing dependency-based alert suppression so downstream alerts are grouped under their root cause; setting dynamic thresholds rather than static ones so alerting adapts to actual baseline behavior; configuring alert deduplication to prevent the same condition from generating multiple tickets; and tuning escalation policies so alerts reach the right person at the right severity level. Platforms with built-in alert noise reduction, such as Auvik’s Smart Alert Suppression, LogicMonitor’s Edwin AI, and Domotz’s Event Dependency, handle much of this automatically.
FCAPS stands for Fault, Configuration, Accounting, Performance, and Security. These are the five functional areas of network management defined by the ISO. Fault covers detection and resolution of network faults. Configuration manages device settings and change tracking. Accounting measures usage for billing and capacity. Performance monitors metrics like throughput and latency. Security handles access control and threat detection. Most enterprise network management platforms address multiple FCAPS areas simultaneously.
Partially. Detection, correlation, and alert generation can be largely automated with modern platforms. Automated remediation — including executing predefined fixes for known fault patterns without human intervention — is available in platforms like LogicMonitor (automated runbooks), Cisco Catalyst Center (Loop Detection Guard), and ManageEngine (workflow automation). However, full autonomous fault resolution without human oversight remains limited in 2026. EMA research found that only 44 percent of network teams trust their monitoring data enough to act on AI-driven recommendations automatically. The practical goal is reducing human time-to-engage, not eliminating human judgment from the resolution process.
Domotz was designed for MSPs and distributed IT environments where traditional on-premises tools create operational friction. Its differentiators for fault management include built-in remote access (RDP, SSH, HTTP/S without VPN) so engineers can respond to faults immediately after detection; Event Dependency for alert noise reduction; transparent per-device pricing with no tiers or add-ons; 15-minute deployment versus the days or weeks required by enterprise platforms; and remote power management across 15-plus PDU and PoE switch brands, giving teams actual remediation capability alongside detection.
Final Thoughts
Network fault management is not a product category you buy and forget. It is an operational discipline that determines how quickly your team detects problems, how confidently they identify root causes, and how efficiently they restore service.
For enterprises with Cisco-dominant infrastructure and dedicated NOC teams, Cisco Catalyst Center or SolarWinds NPM deliver fault analysis at a depth that is hard to match, at a cost that reflects it. For organizations needing AIOps-driven intelligence, LogicMonitor’s Edwin AI is the current benchmark. For teams that need solid, practical fault management across distributed environments without the enterprise overhead, Domotz delivers comprehensive alerting, topology visibility, and built-in remote access at a price point no competitor touches.
The best network fault management tool is the one your team will actually use, can deploy quickly, and can sustain operationally. Start there.